Planetary Health Check
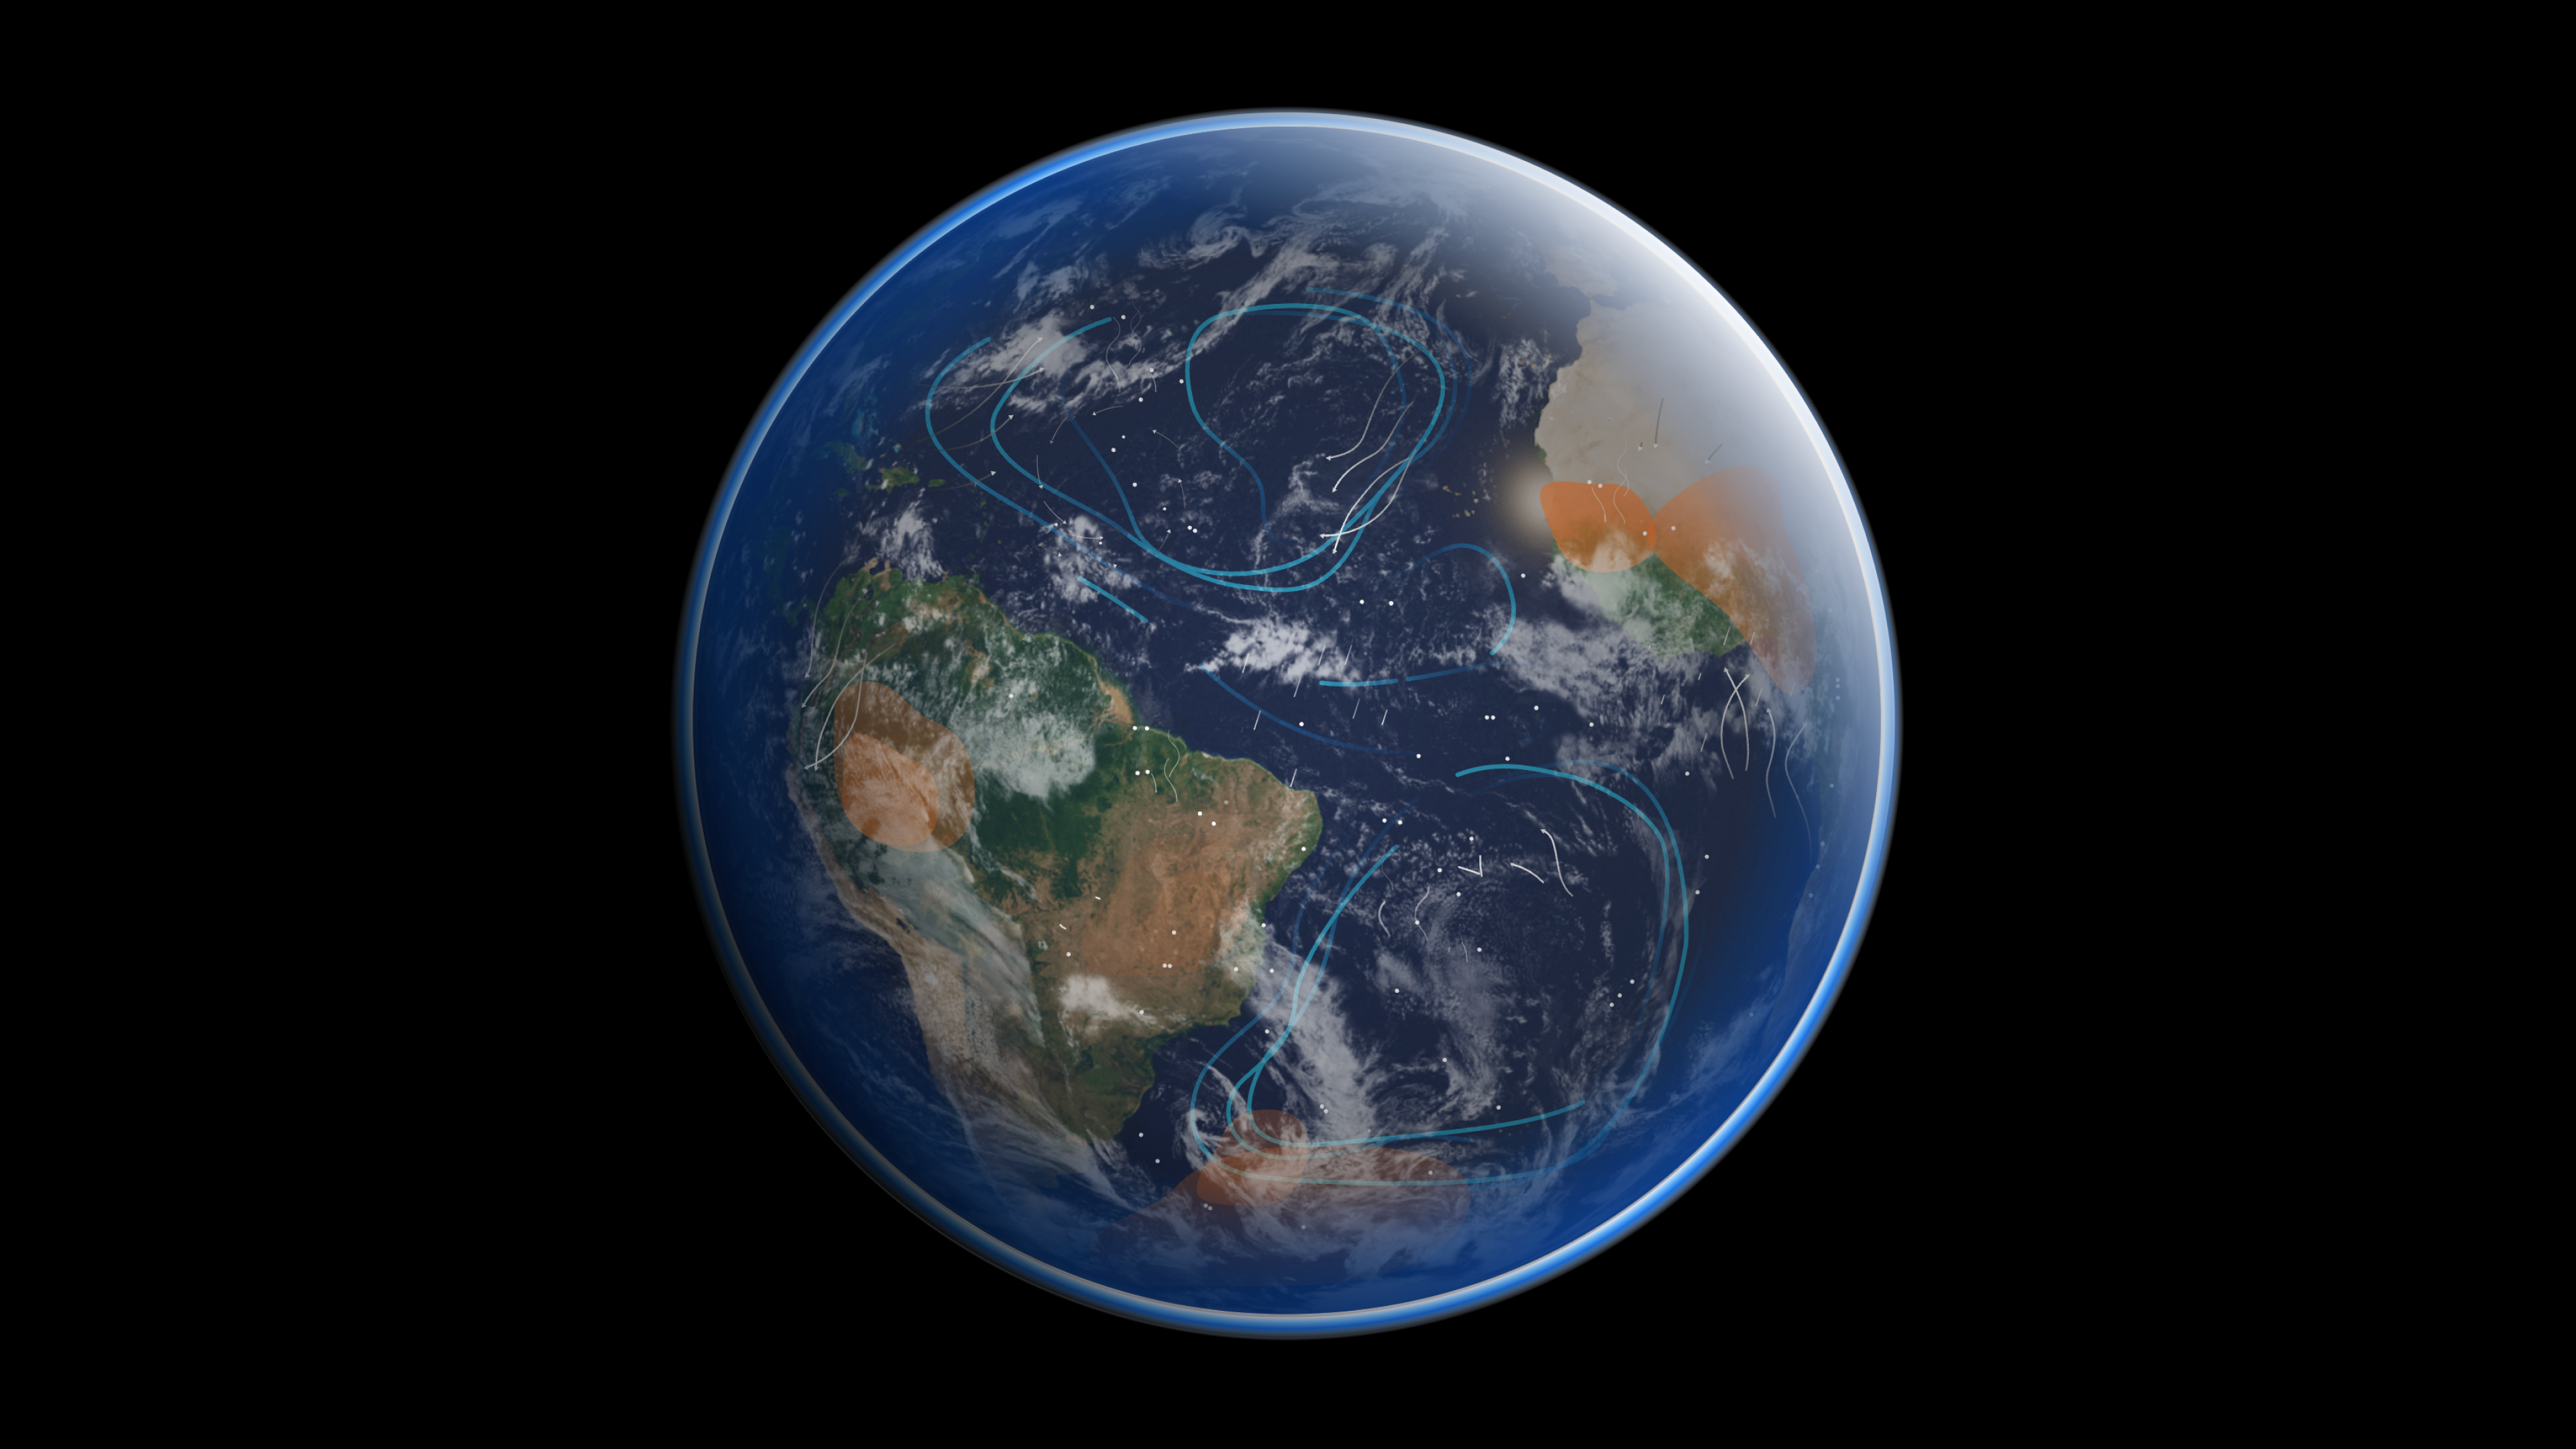
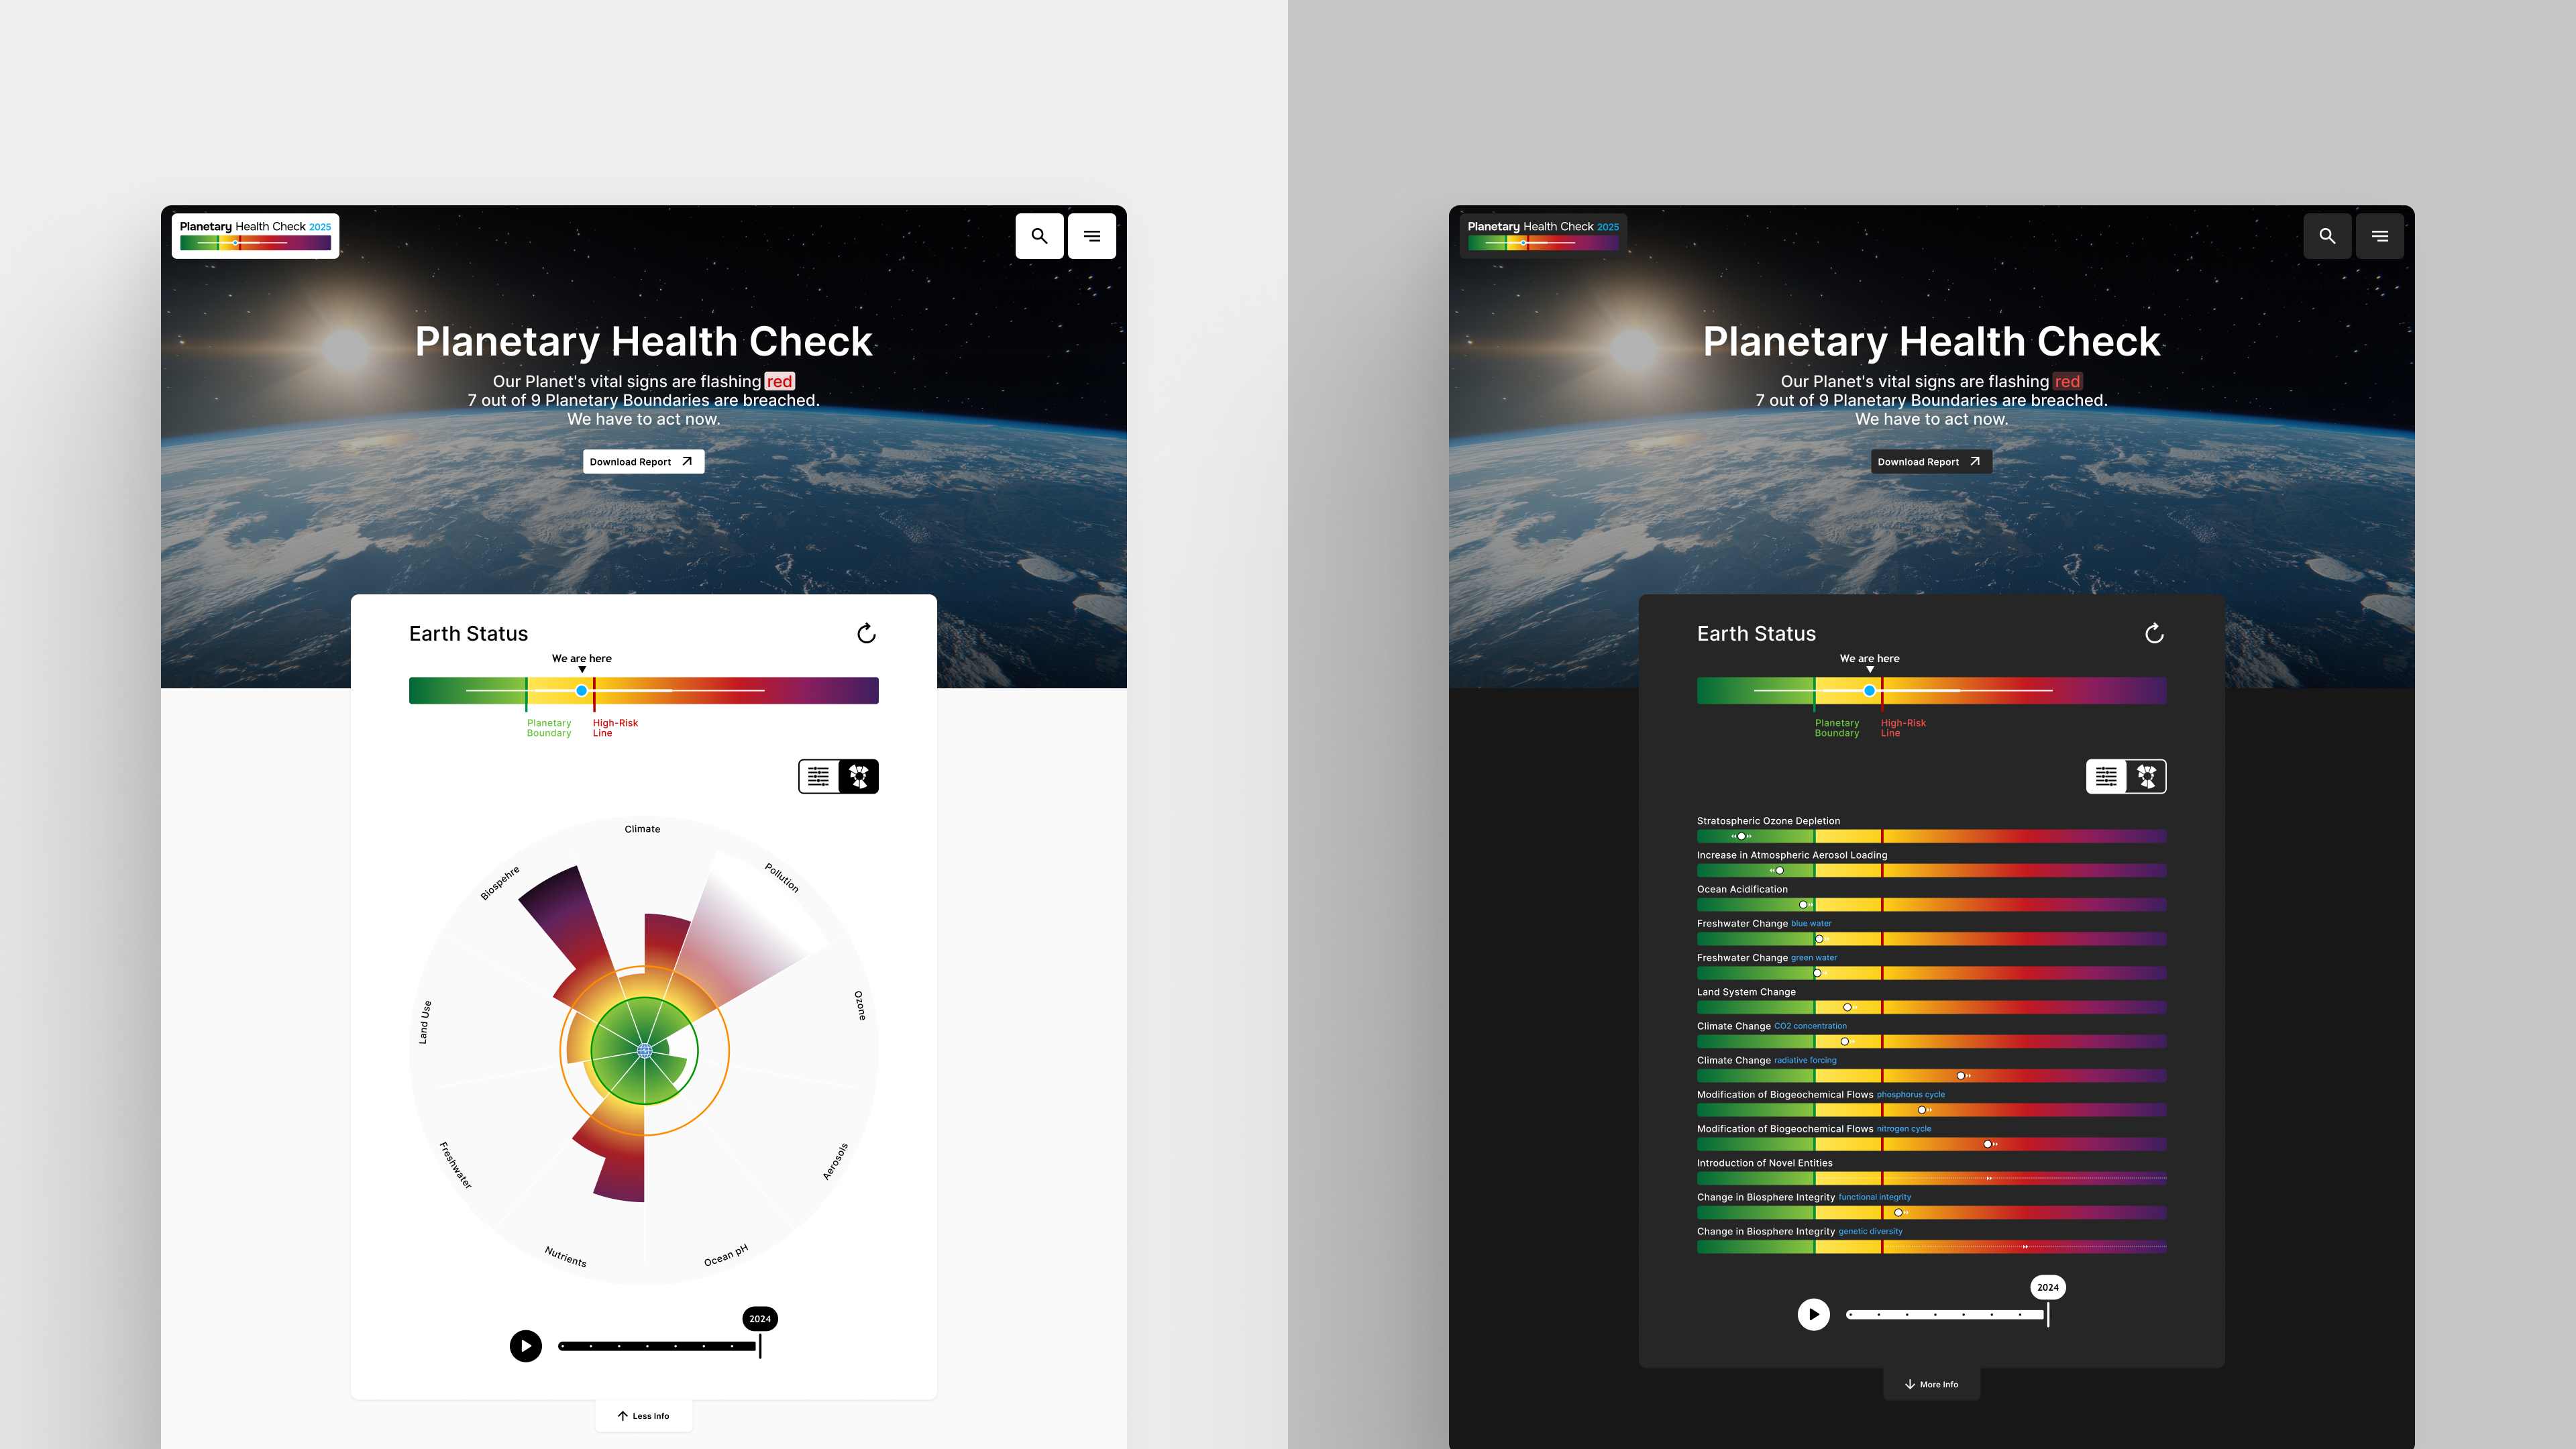
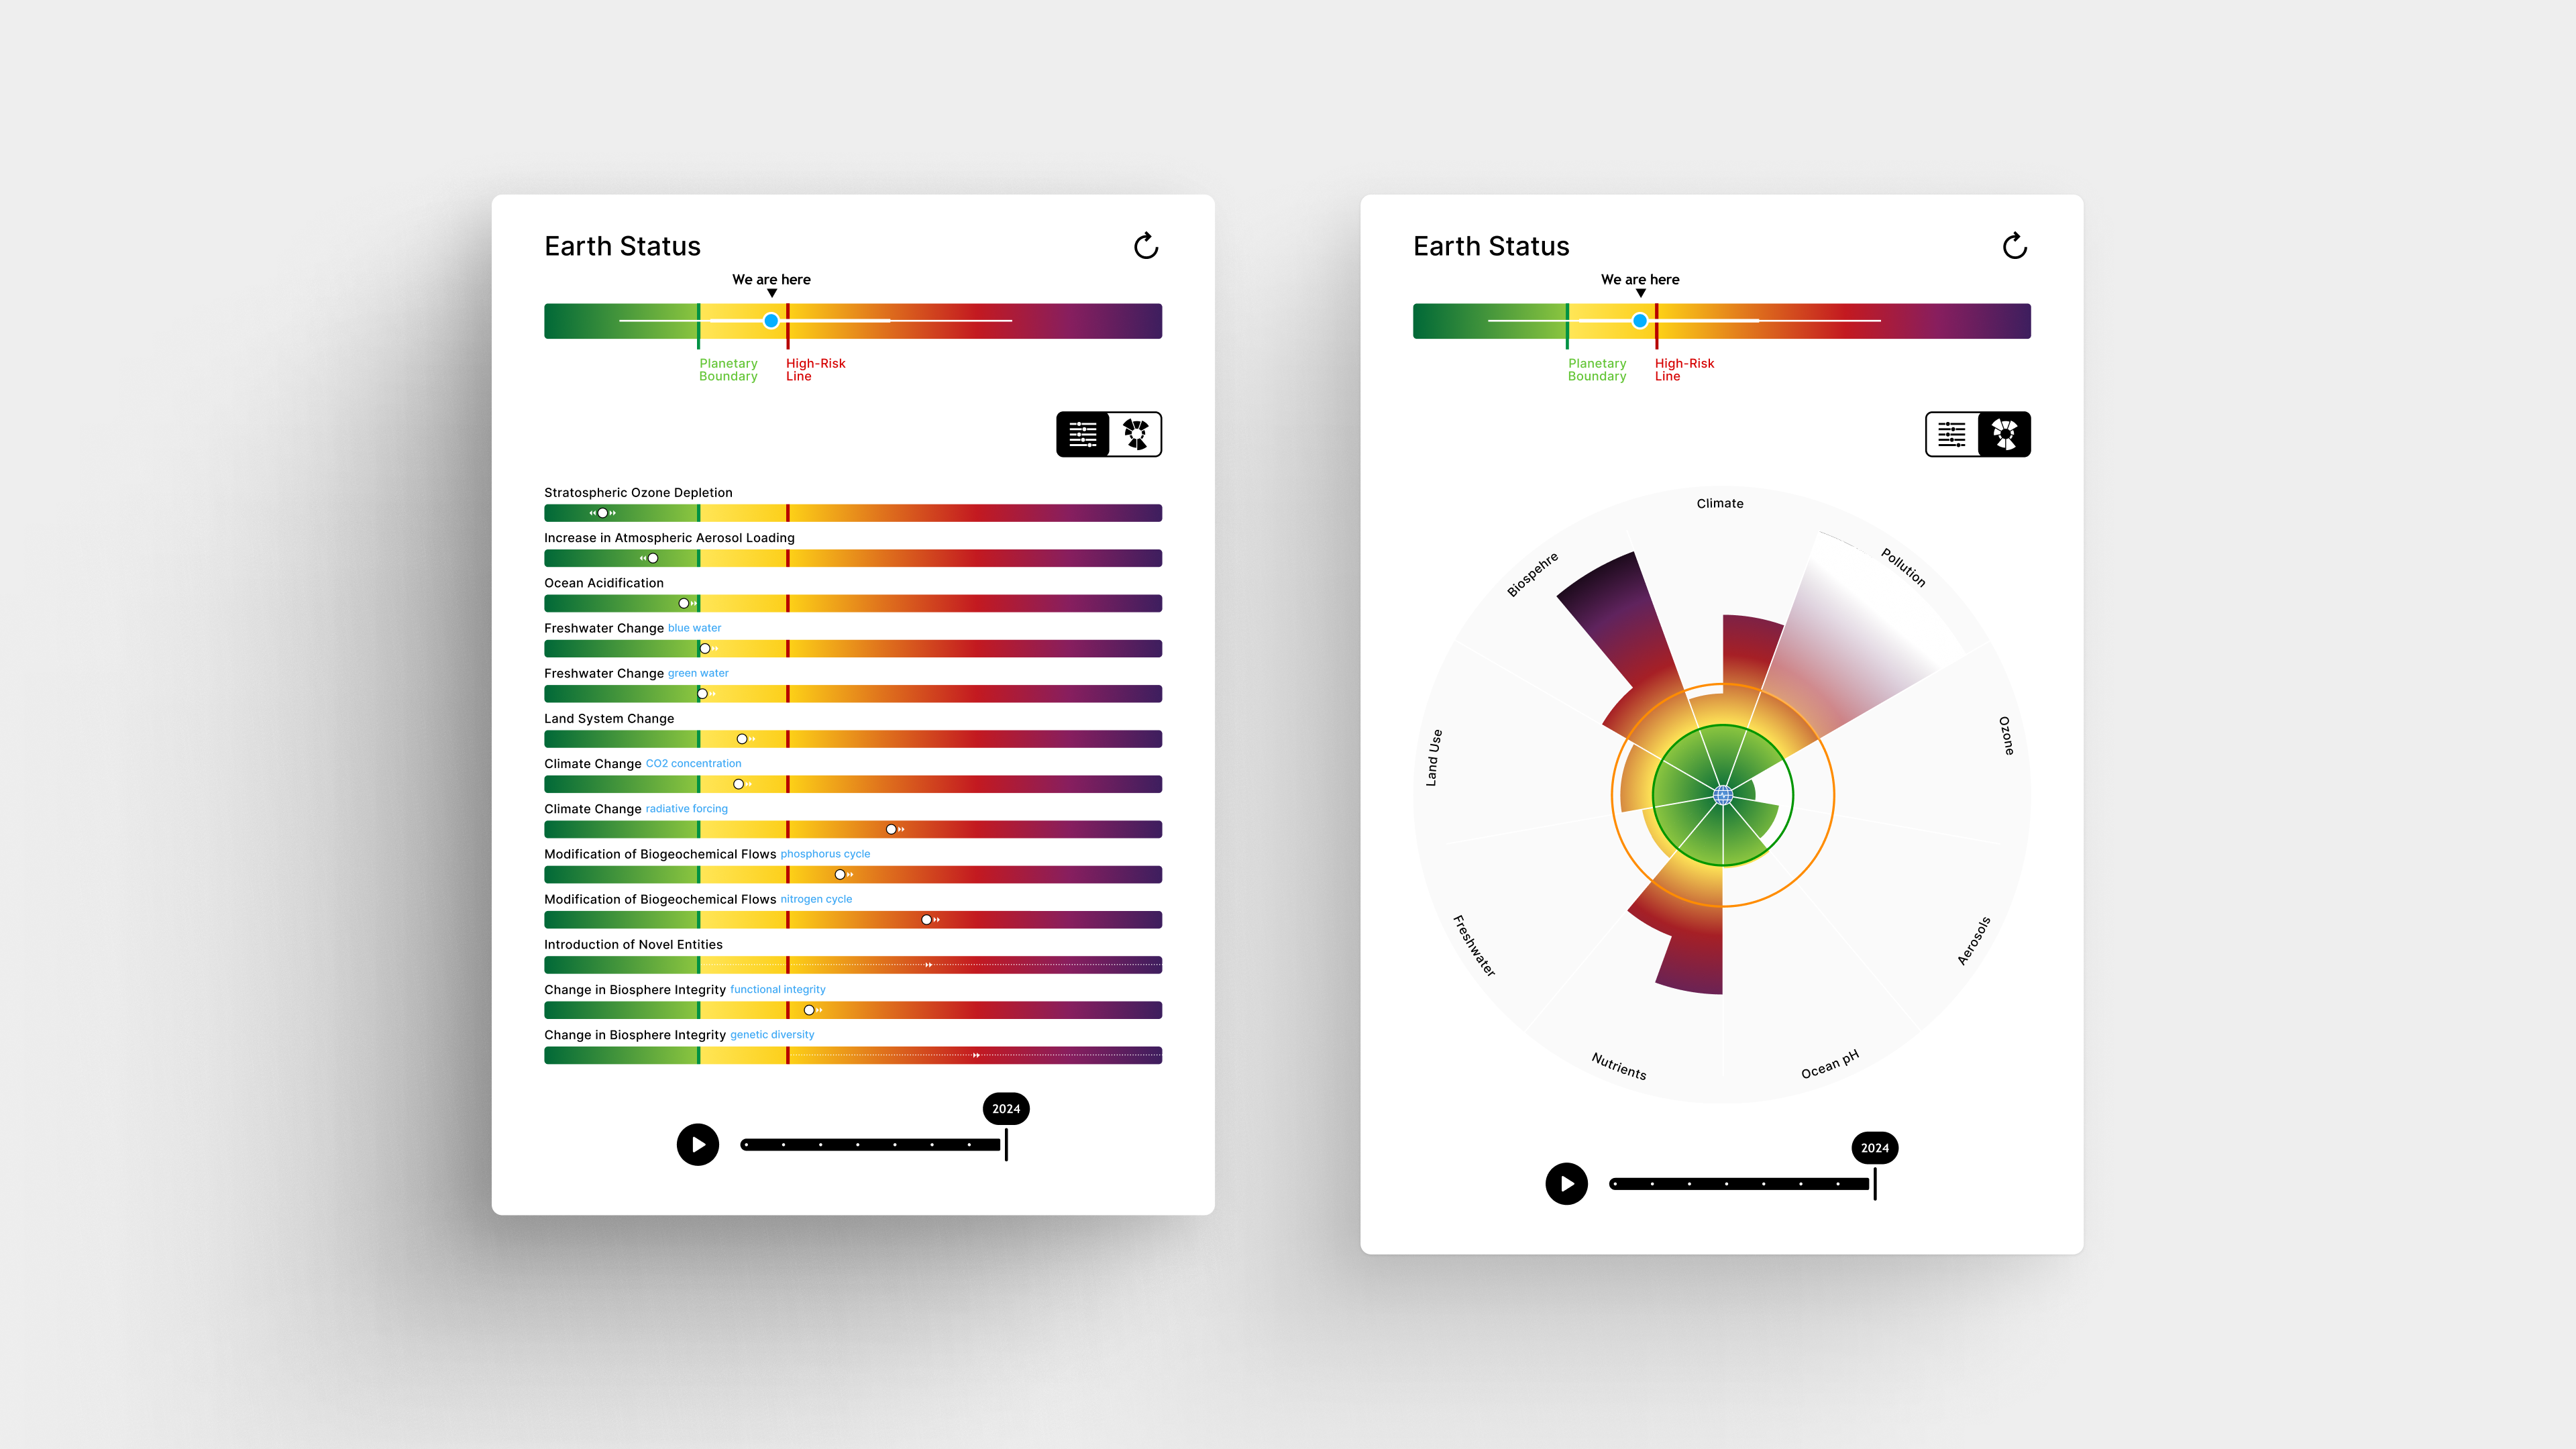
For the Planetary Health Check, we developed the complete web presence on the state of our planet's health, on behalf of the Potsdam Institute for Climate Impact Research (PIK). The foundation is the planetary boundaries framework, established in 2009, which describes nine critical Earth system processes such as climate change, ocean acidification, and pollution, and defines scientifically grounded limits for each.
Project features:
- Data Visualization
- Science
- Scrollytelling
- Interactive App
- Client: Potsdam Institute for Climate Impact Research
- Services: Concept, Visual Identity, Data Visualization, UI-Design, Web Development
For each of the nine boundaries, we developed a dedicated interactive visualization, all brought together in a comprehensive overview with all underlying datasets independently manageable by the team in the backend.
An introductory scrollytelling guides users into the concept and the visualizations. A flexible modular system allows the team to independently create and embed news articles and data stories throughout the site. The entire corporate design was created by us and documented in a styleguide, with the technical infrastructure built on a carefully advised tool selection.