Award-winning
The environment in East Germany
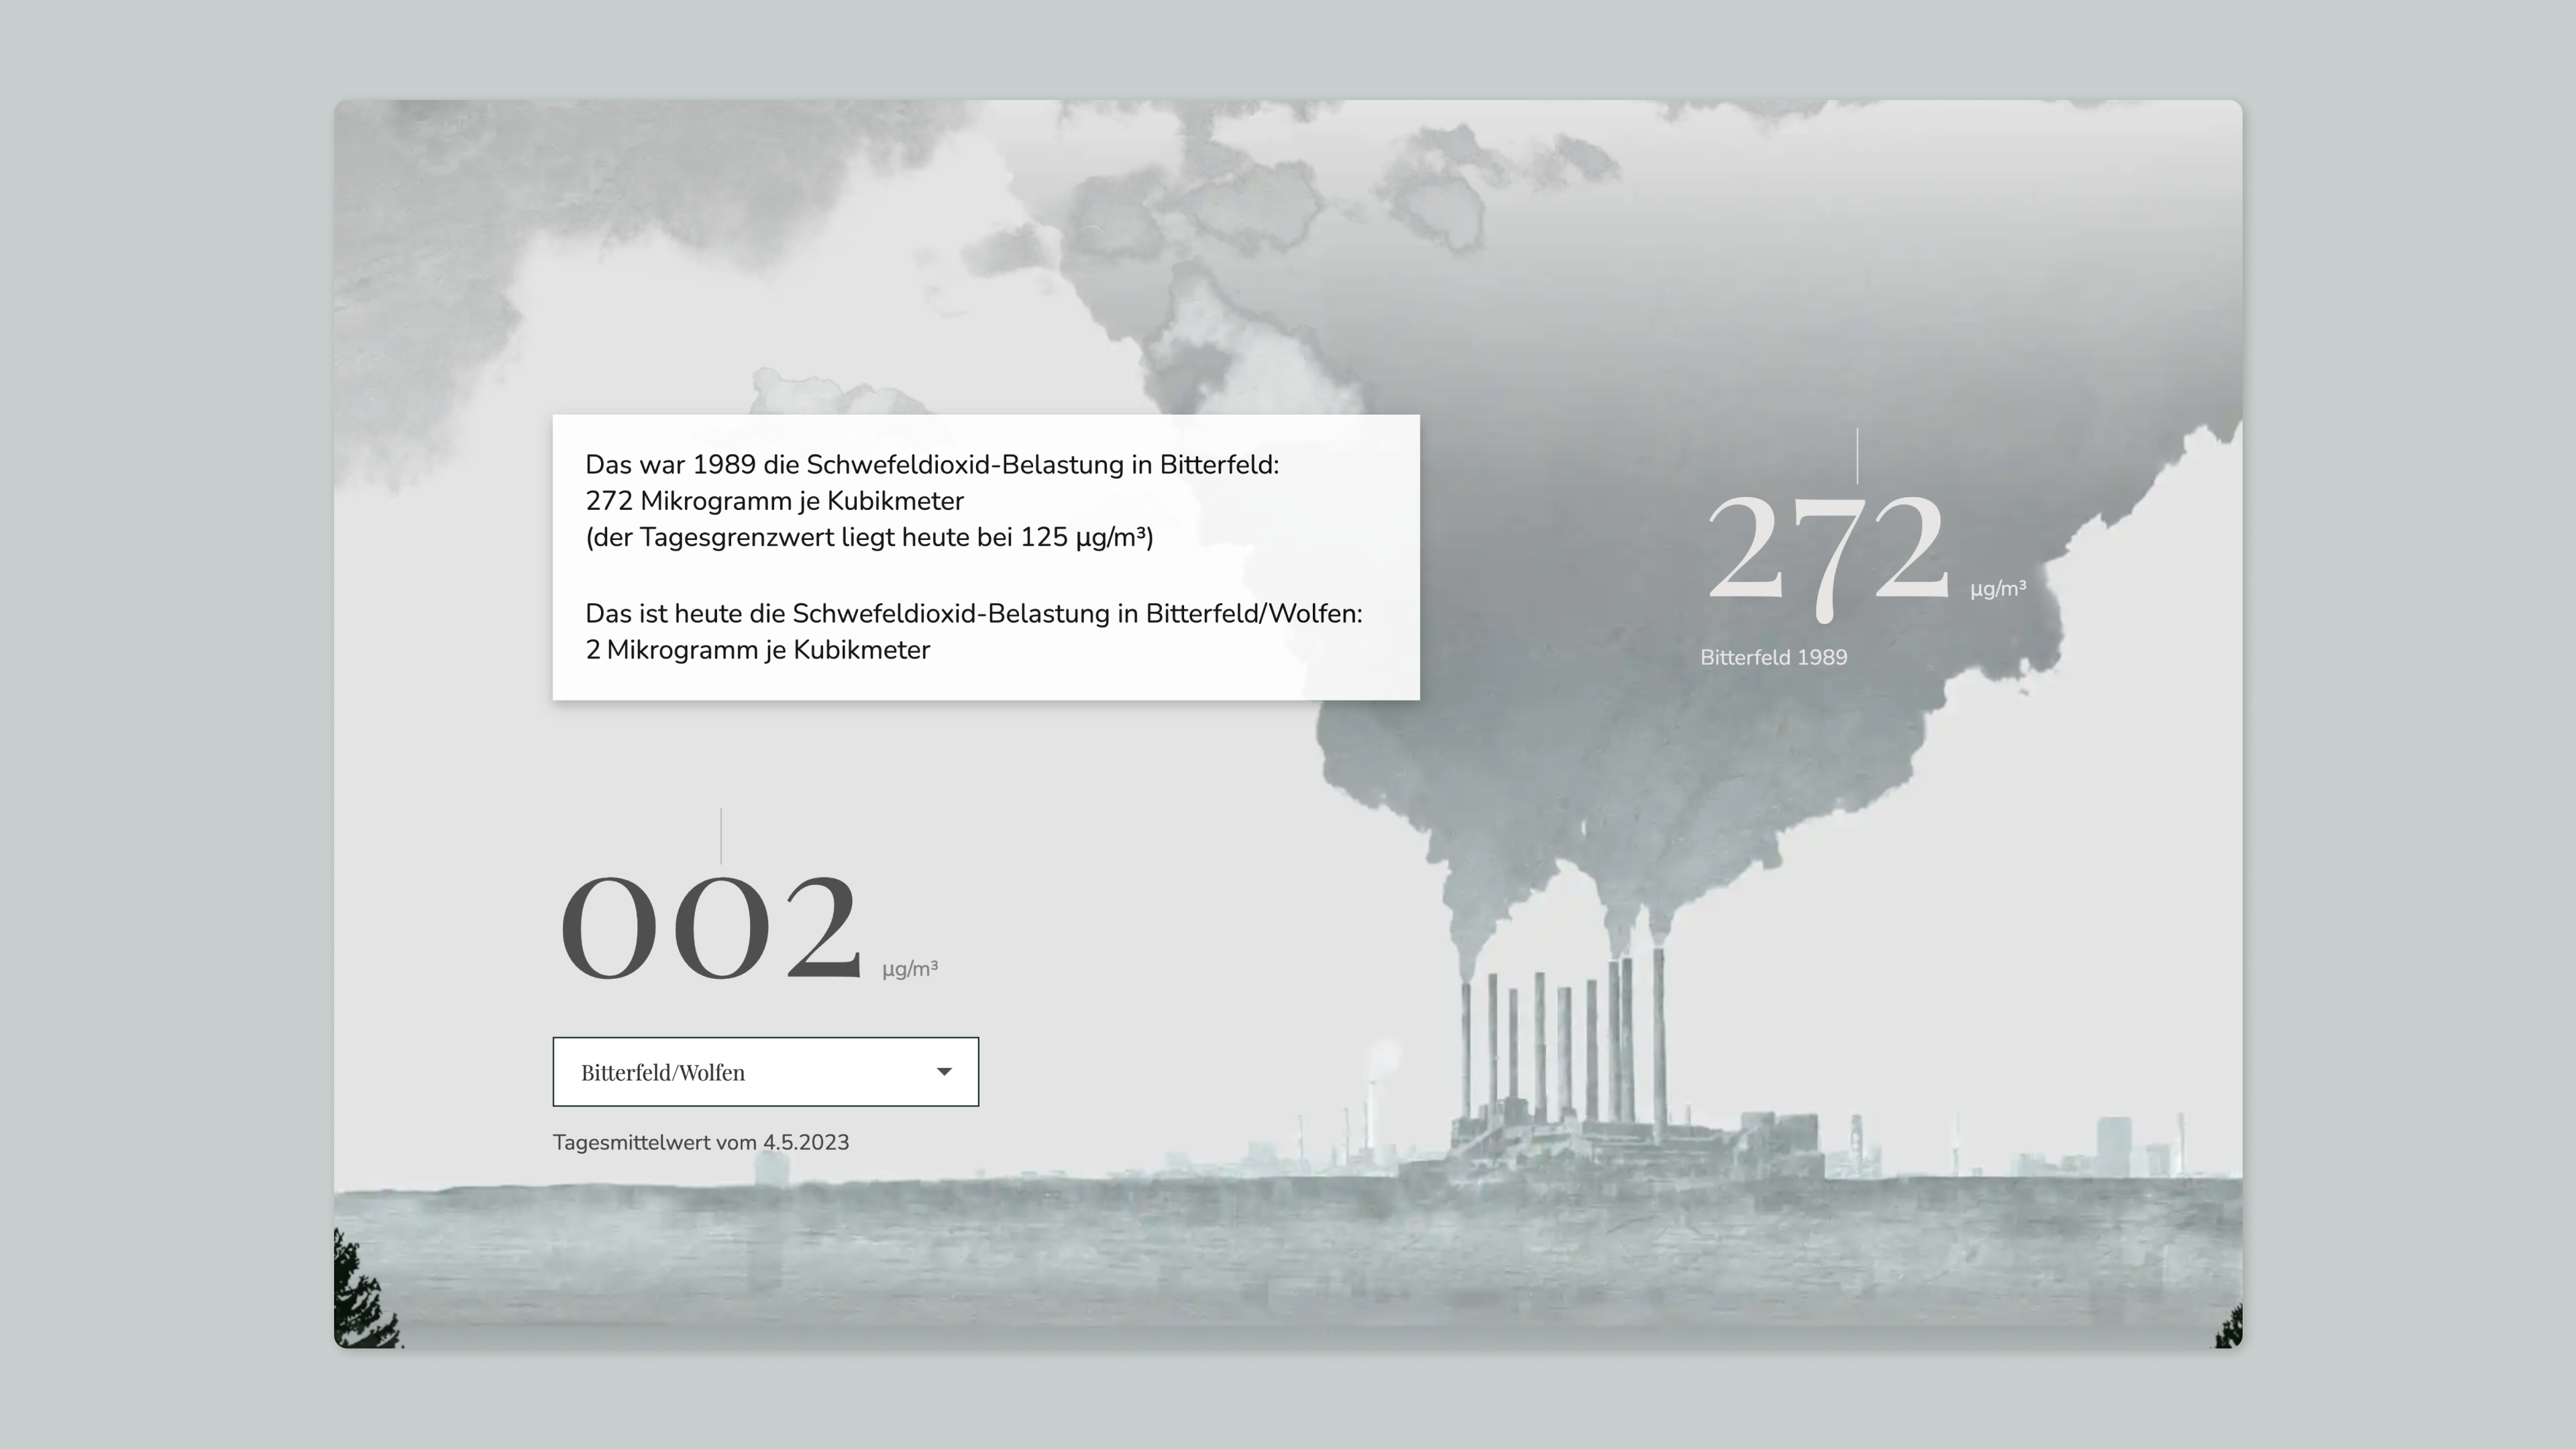
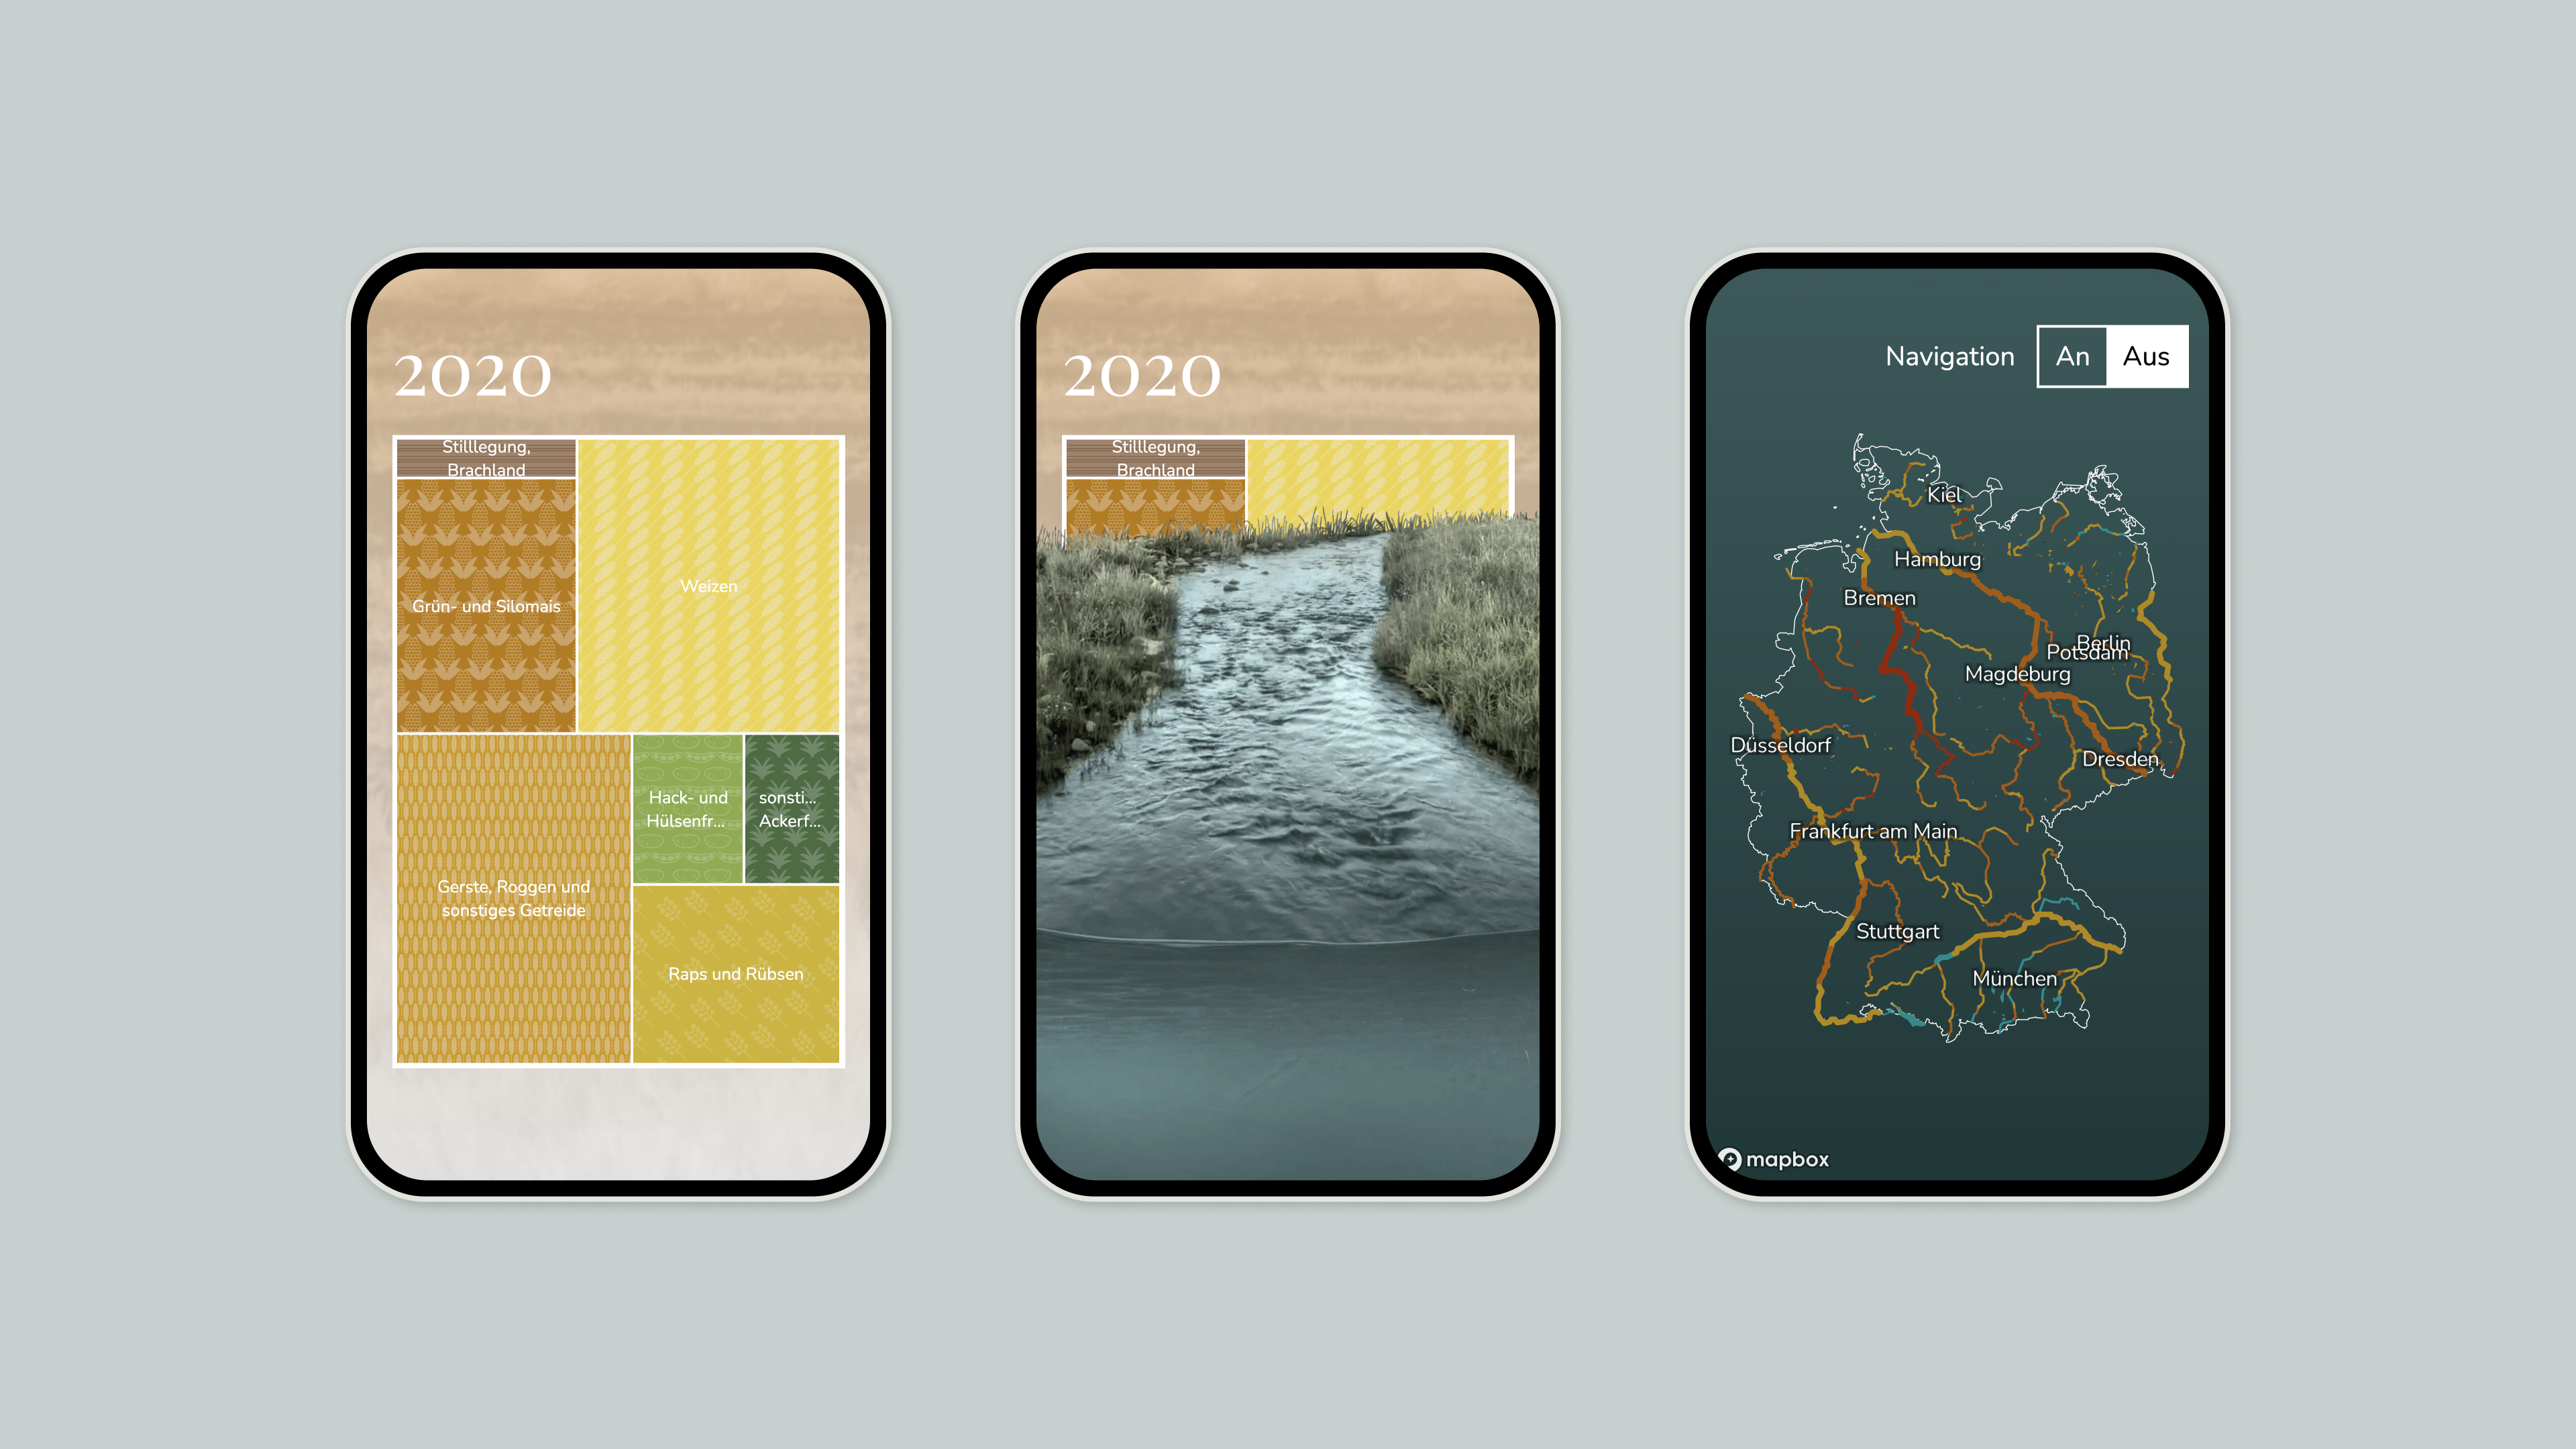
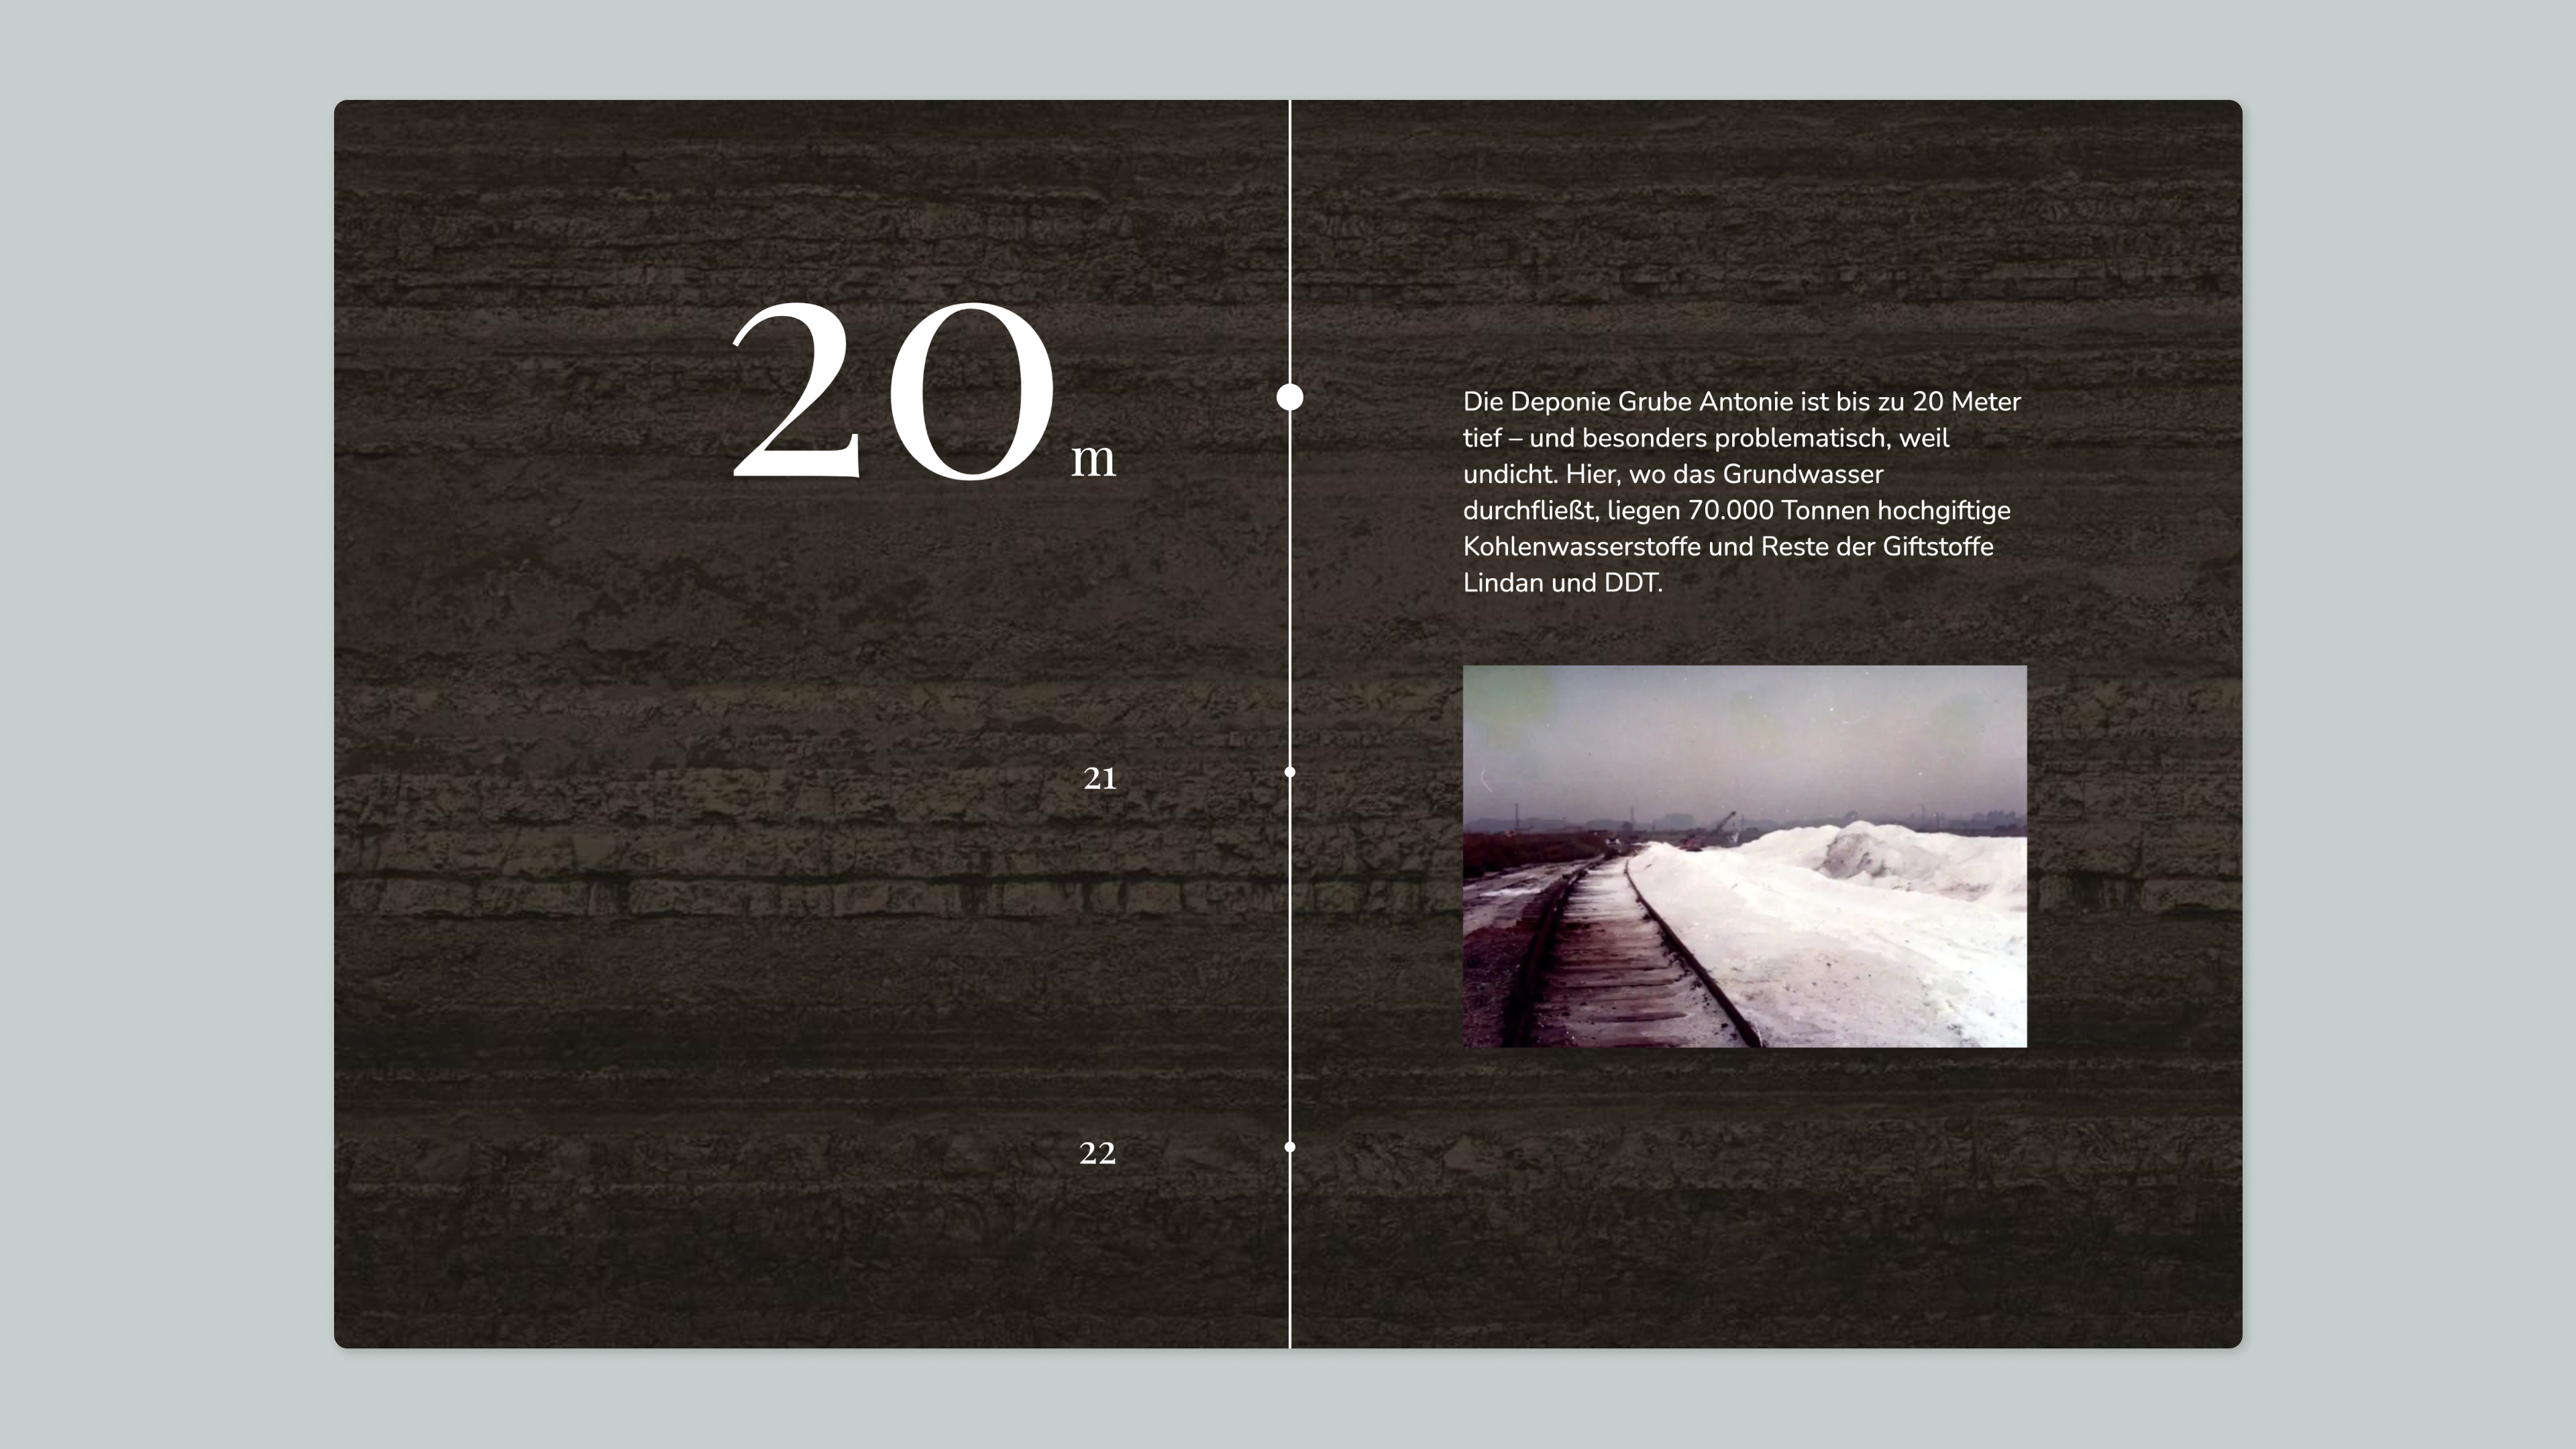
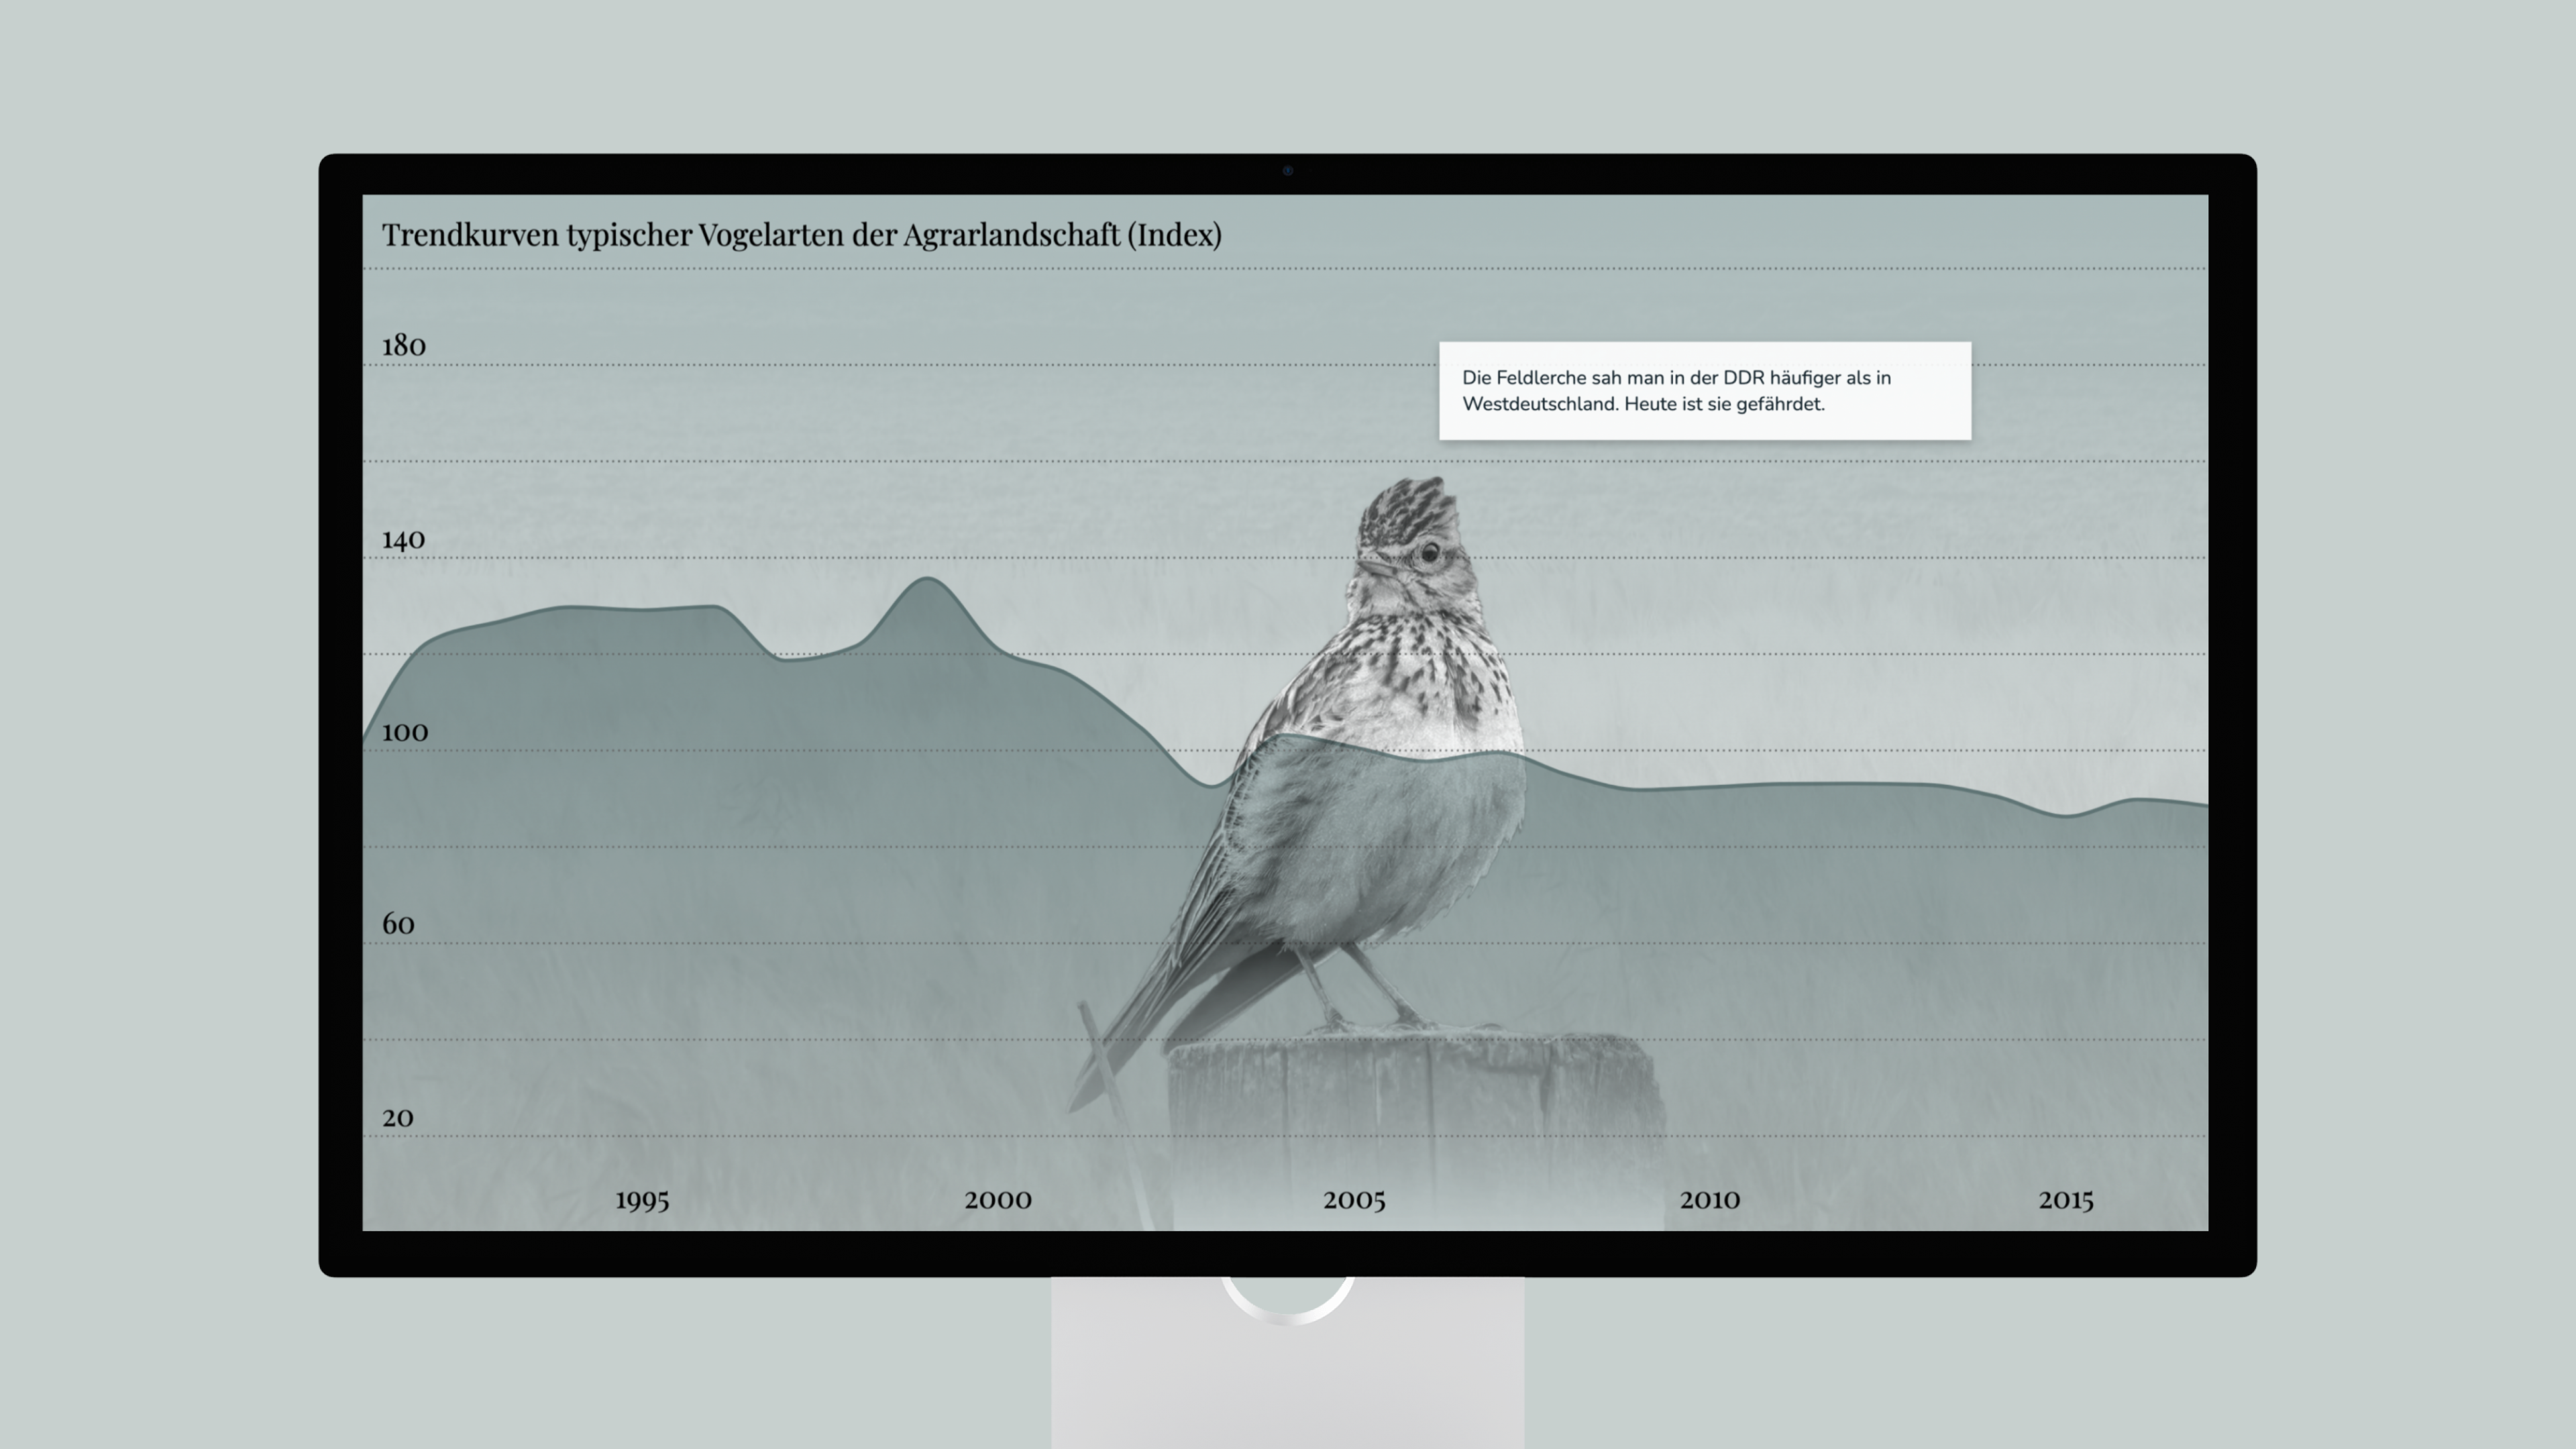
On behalf of Hoferichter and Jacobs, we created an informative website for an MDR documentary series. From a variety of provided datasets, we initially selected suitable ones and developed a coherent storyline that takes the user from the cloud cover to 80 meters below the ground.
Project features:
- Interactive App
- Documentation
- Data Storytelling
- Clients: Hoferichter und Jacobs, MDR
- Services: Visual Identity, Illustration, Data Visualization, Web Development
- Award: Grimme Online Award
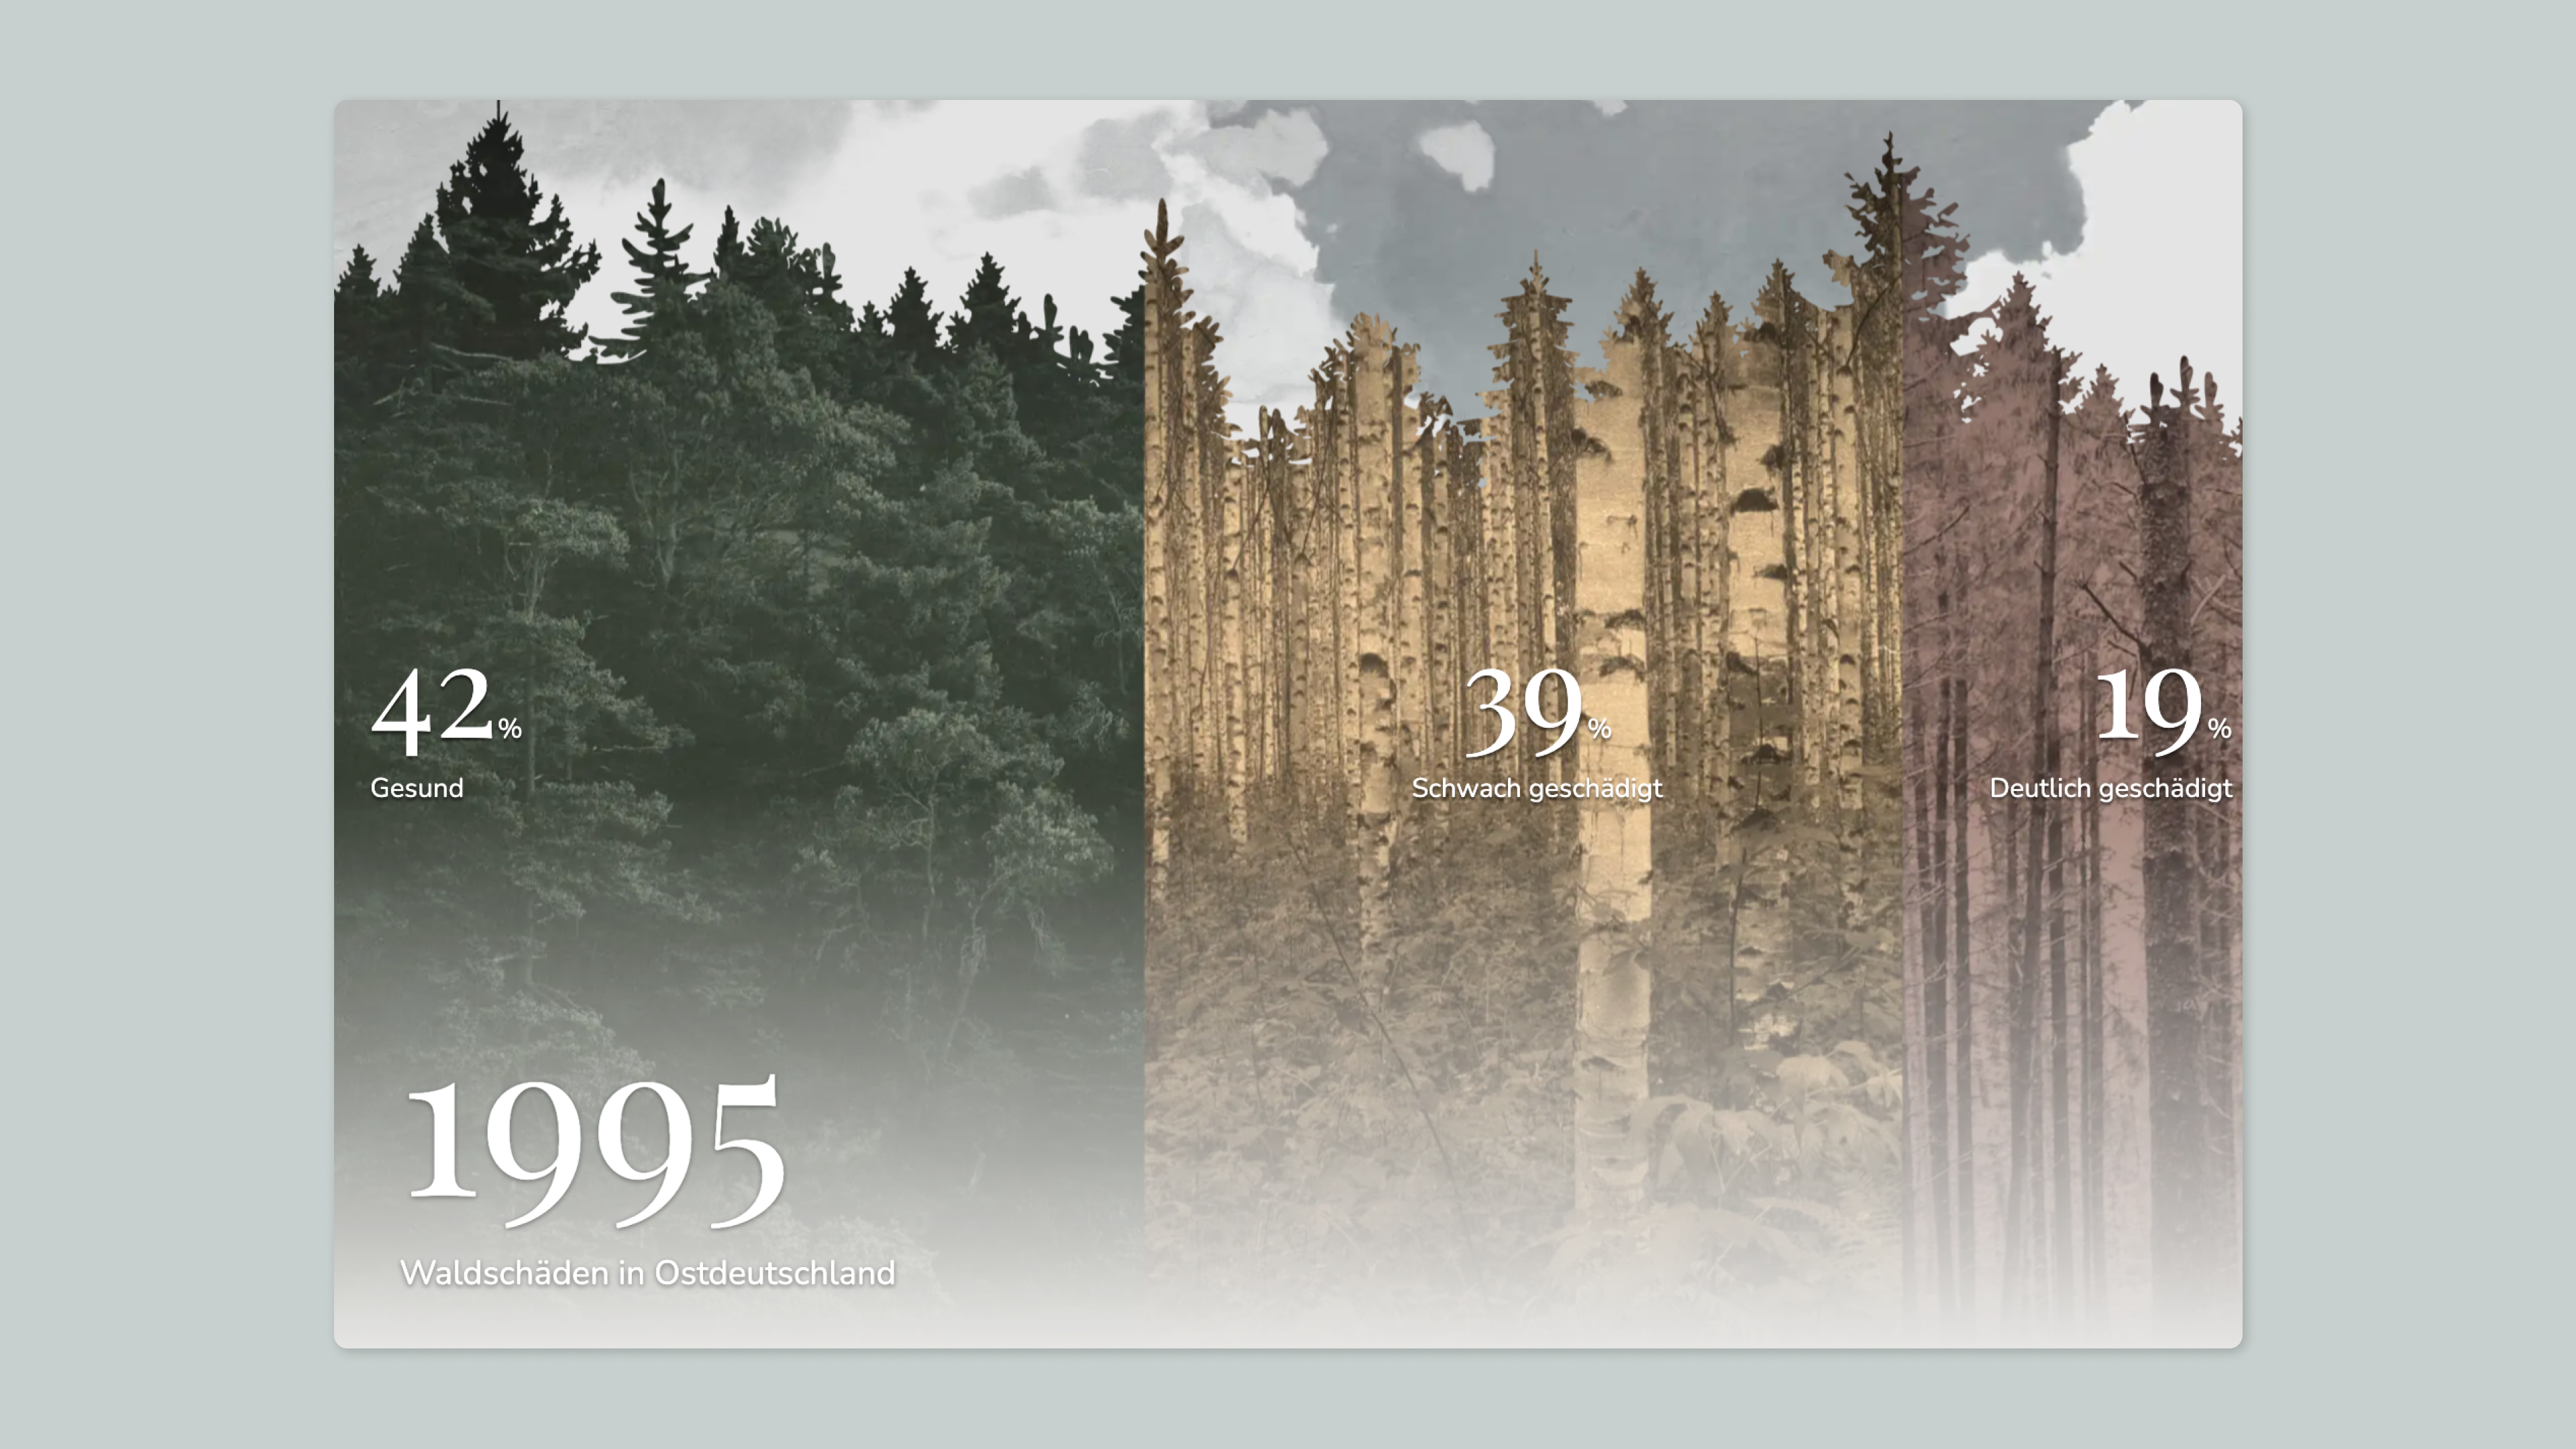
We designed a unique layout that was also adapted for the corresponding MDR documentary series and conceptualized a variety of interactive elements. These include real-time air quality data retrieved from the Federal Environment Agency. This project was the recipient of the 2022 Grimme Online Award.