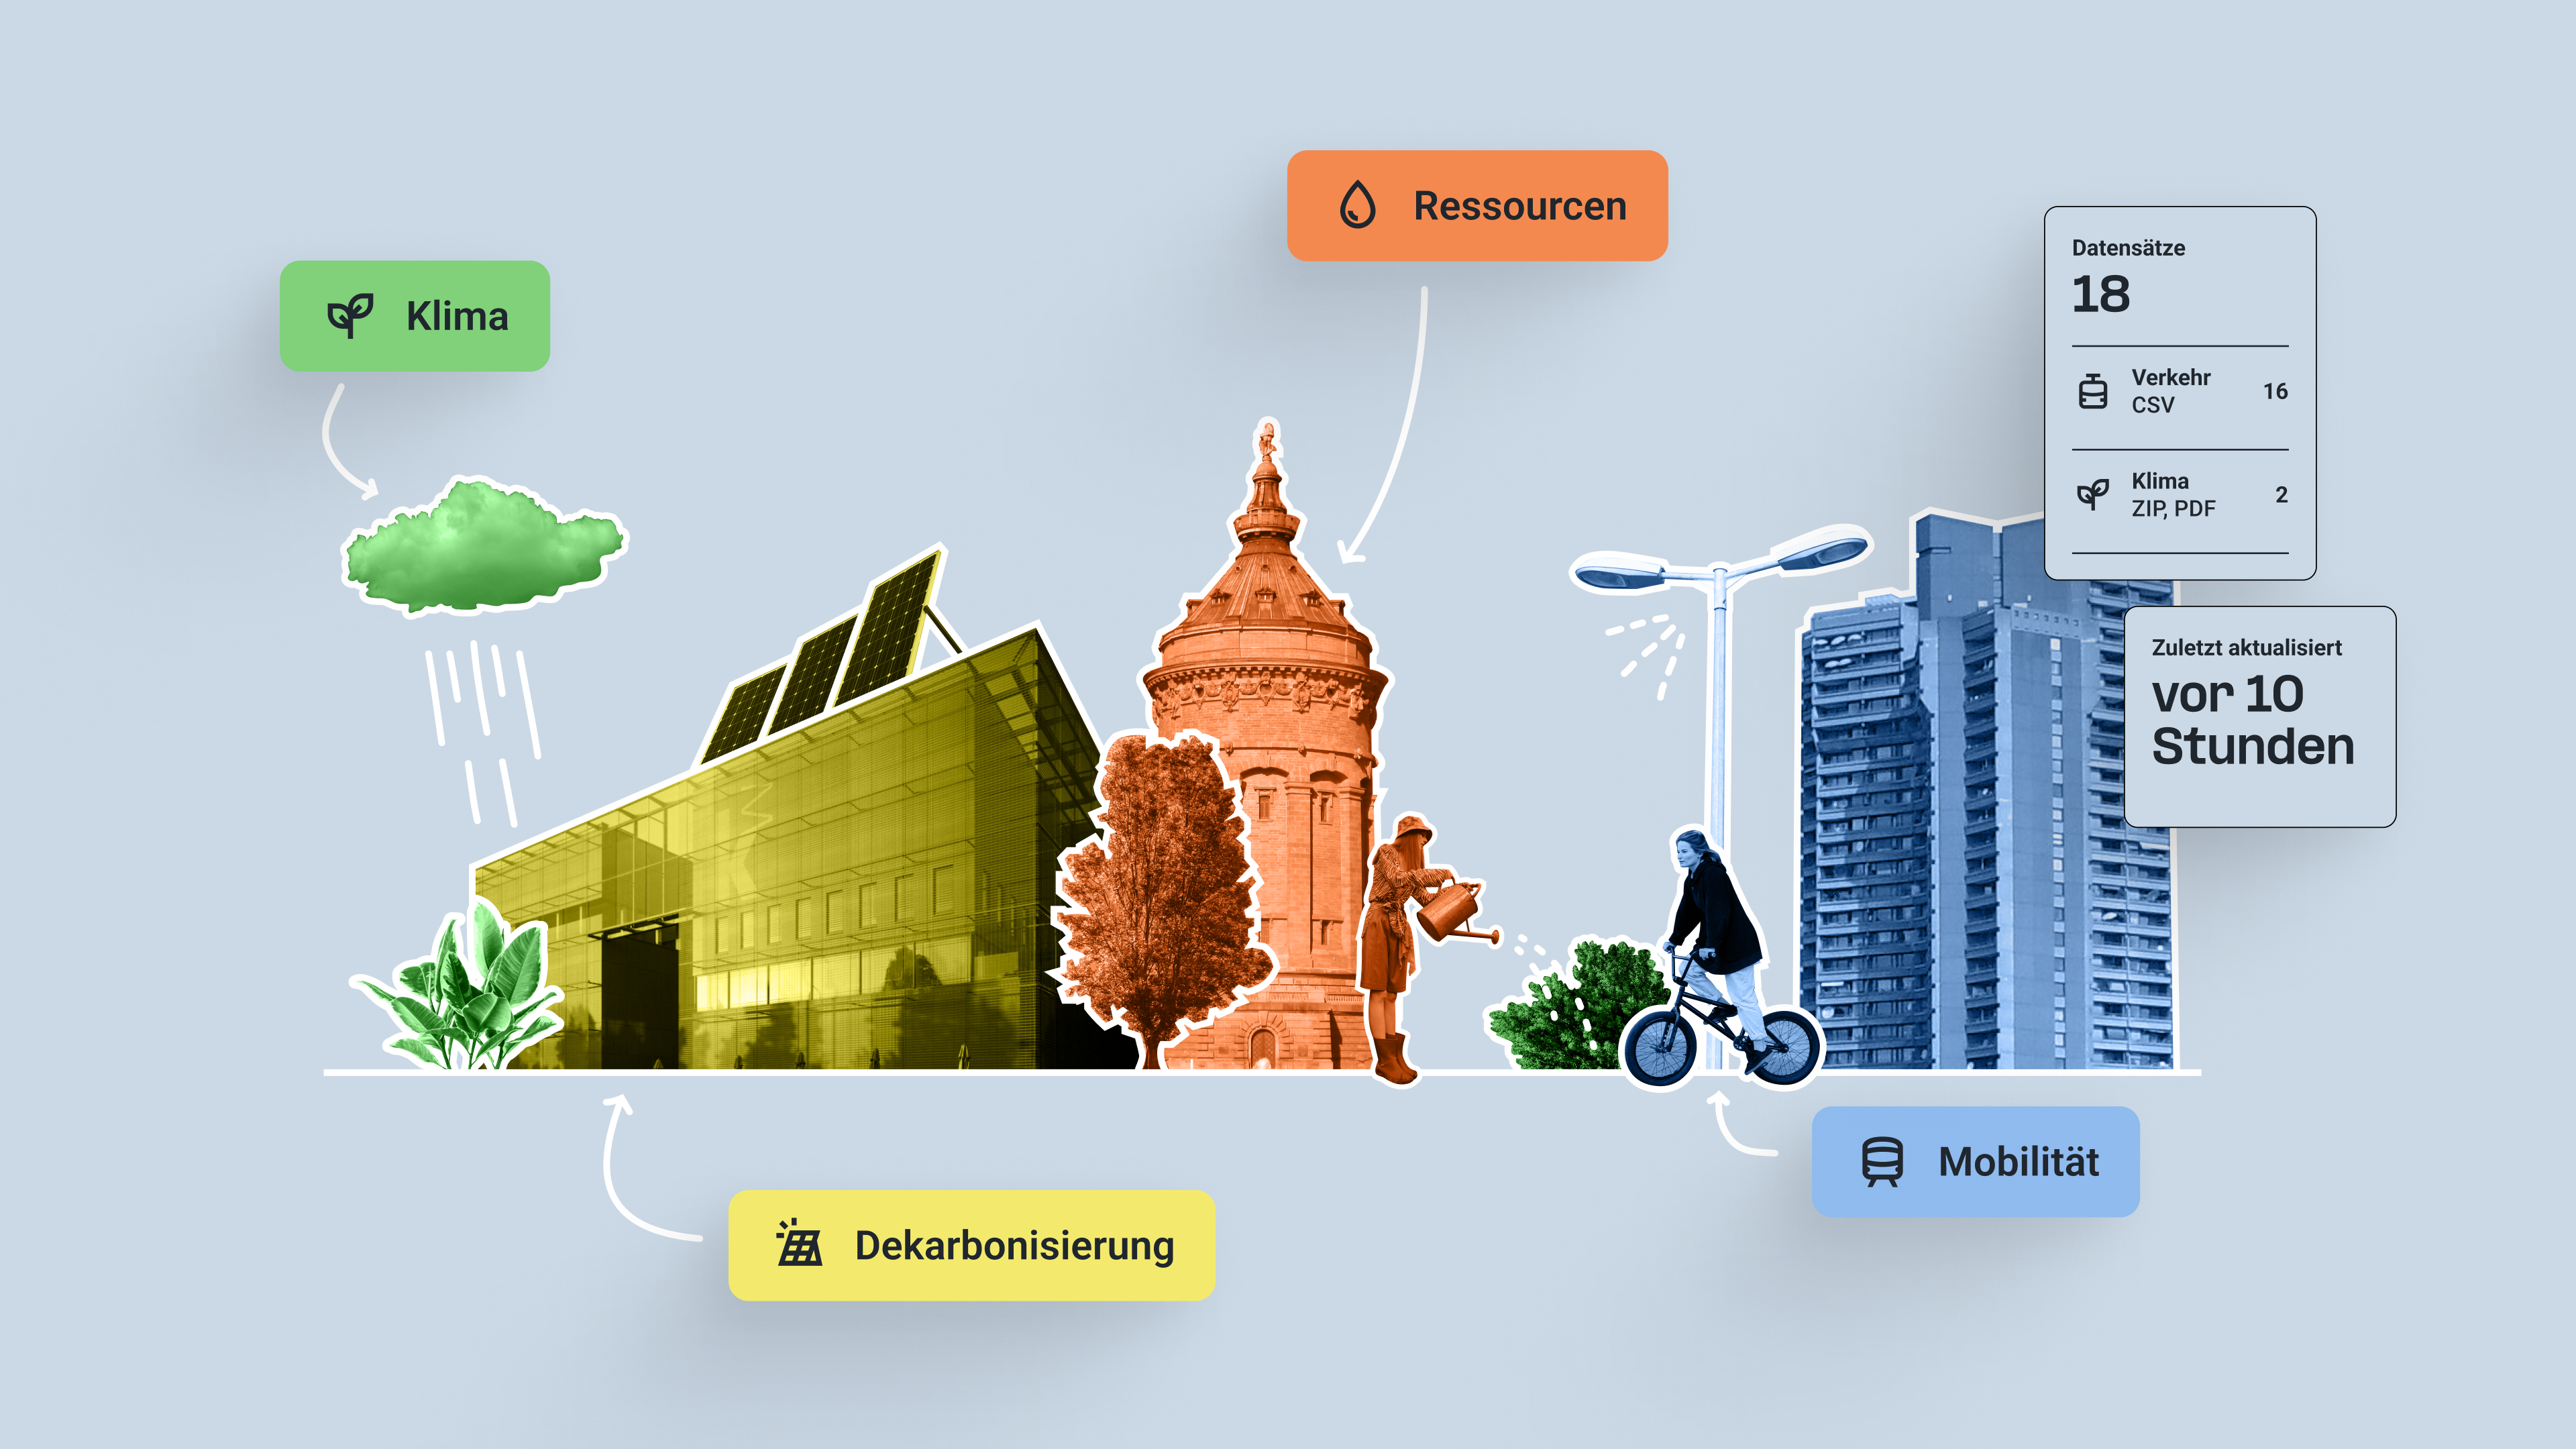
Illustration showing elements of climate, resources, decarbonization, and mobility with icons and labels in German, featuring a solar-paneled building, trees, a cyclist, and urban buildings.

Smart City Mannheim

Smart Cities develop digital solutions to improve the lives of their citizens. Clear communication is essential for public acceptance and participation.

Project features:

  • Design
  • Dashboard
Show AppSmart City Mannheim
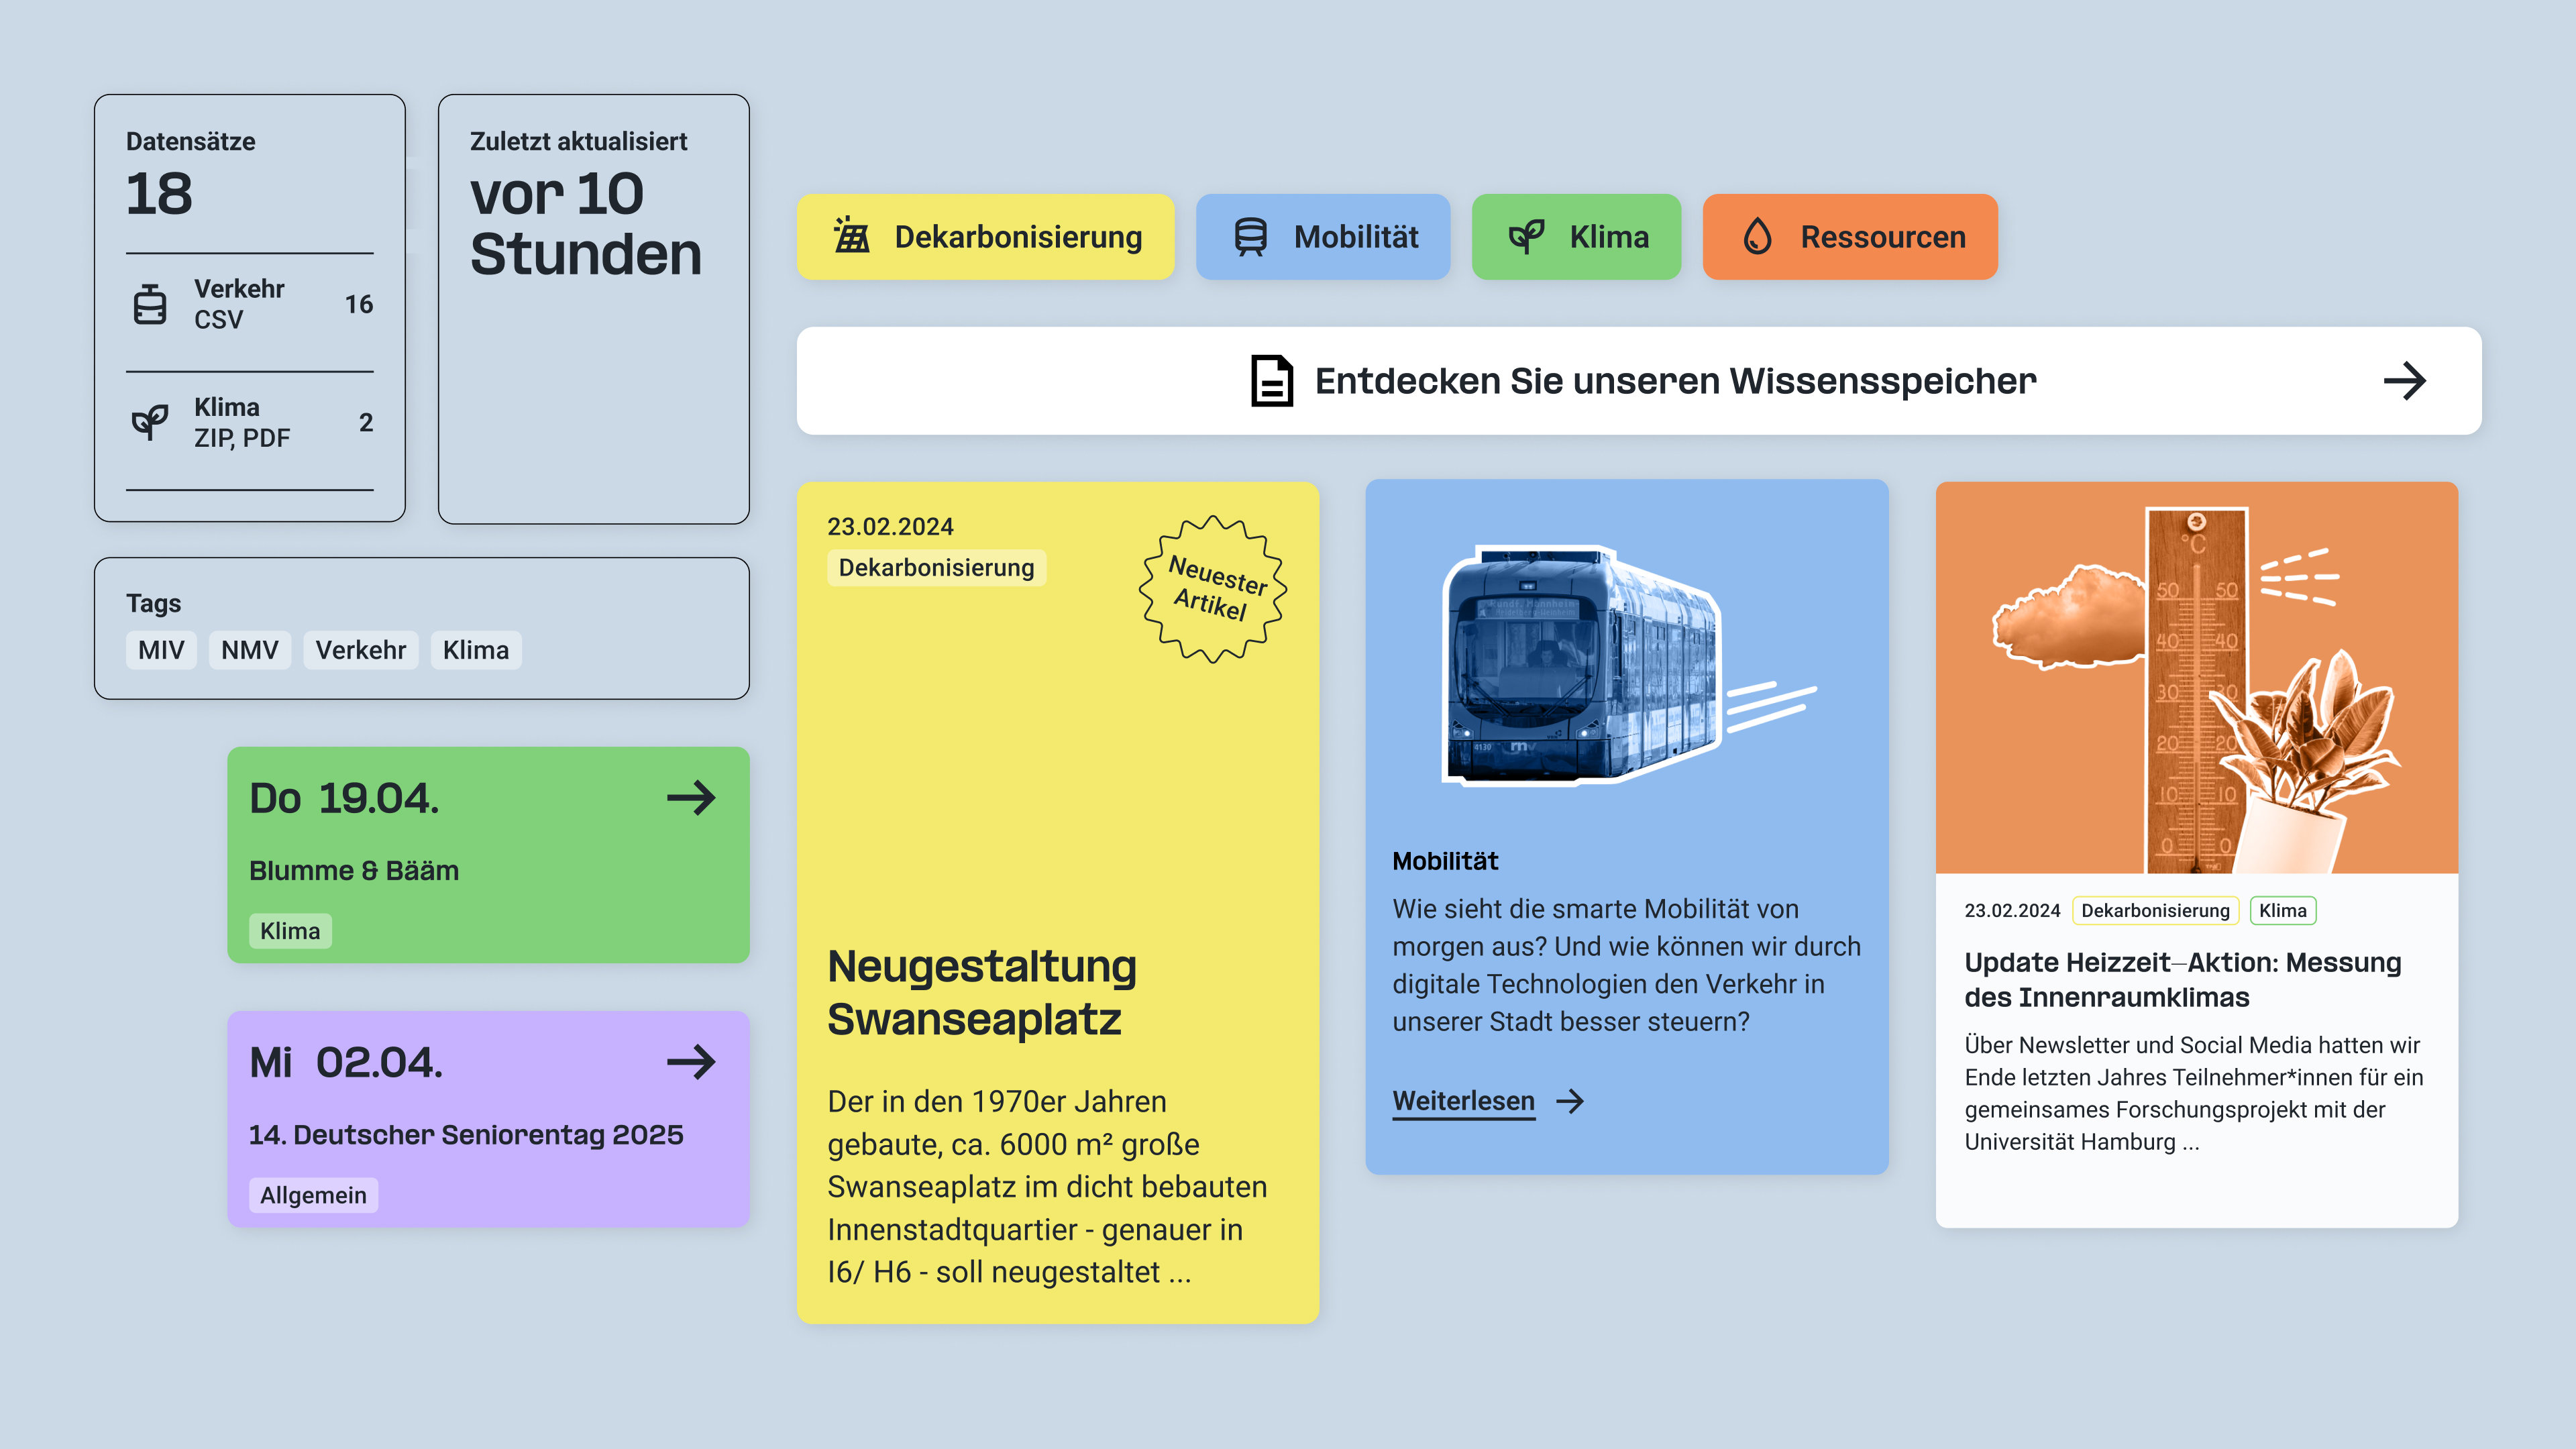
Dashboard showing data sets and tags with sections on decarbonization, mobility, climate, and resources. Highlights include a new seating area built in the 1970s, smart mobility solutions, and an update on indoor air quality measurement.
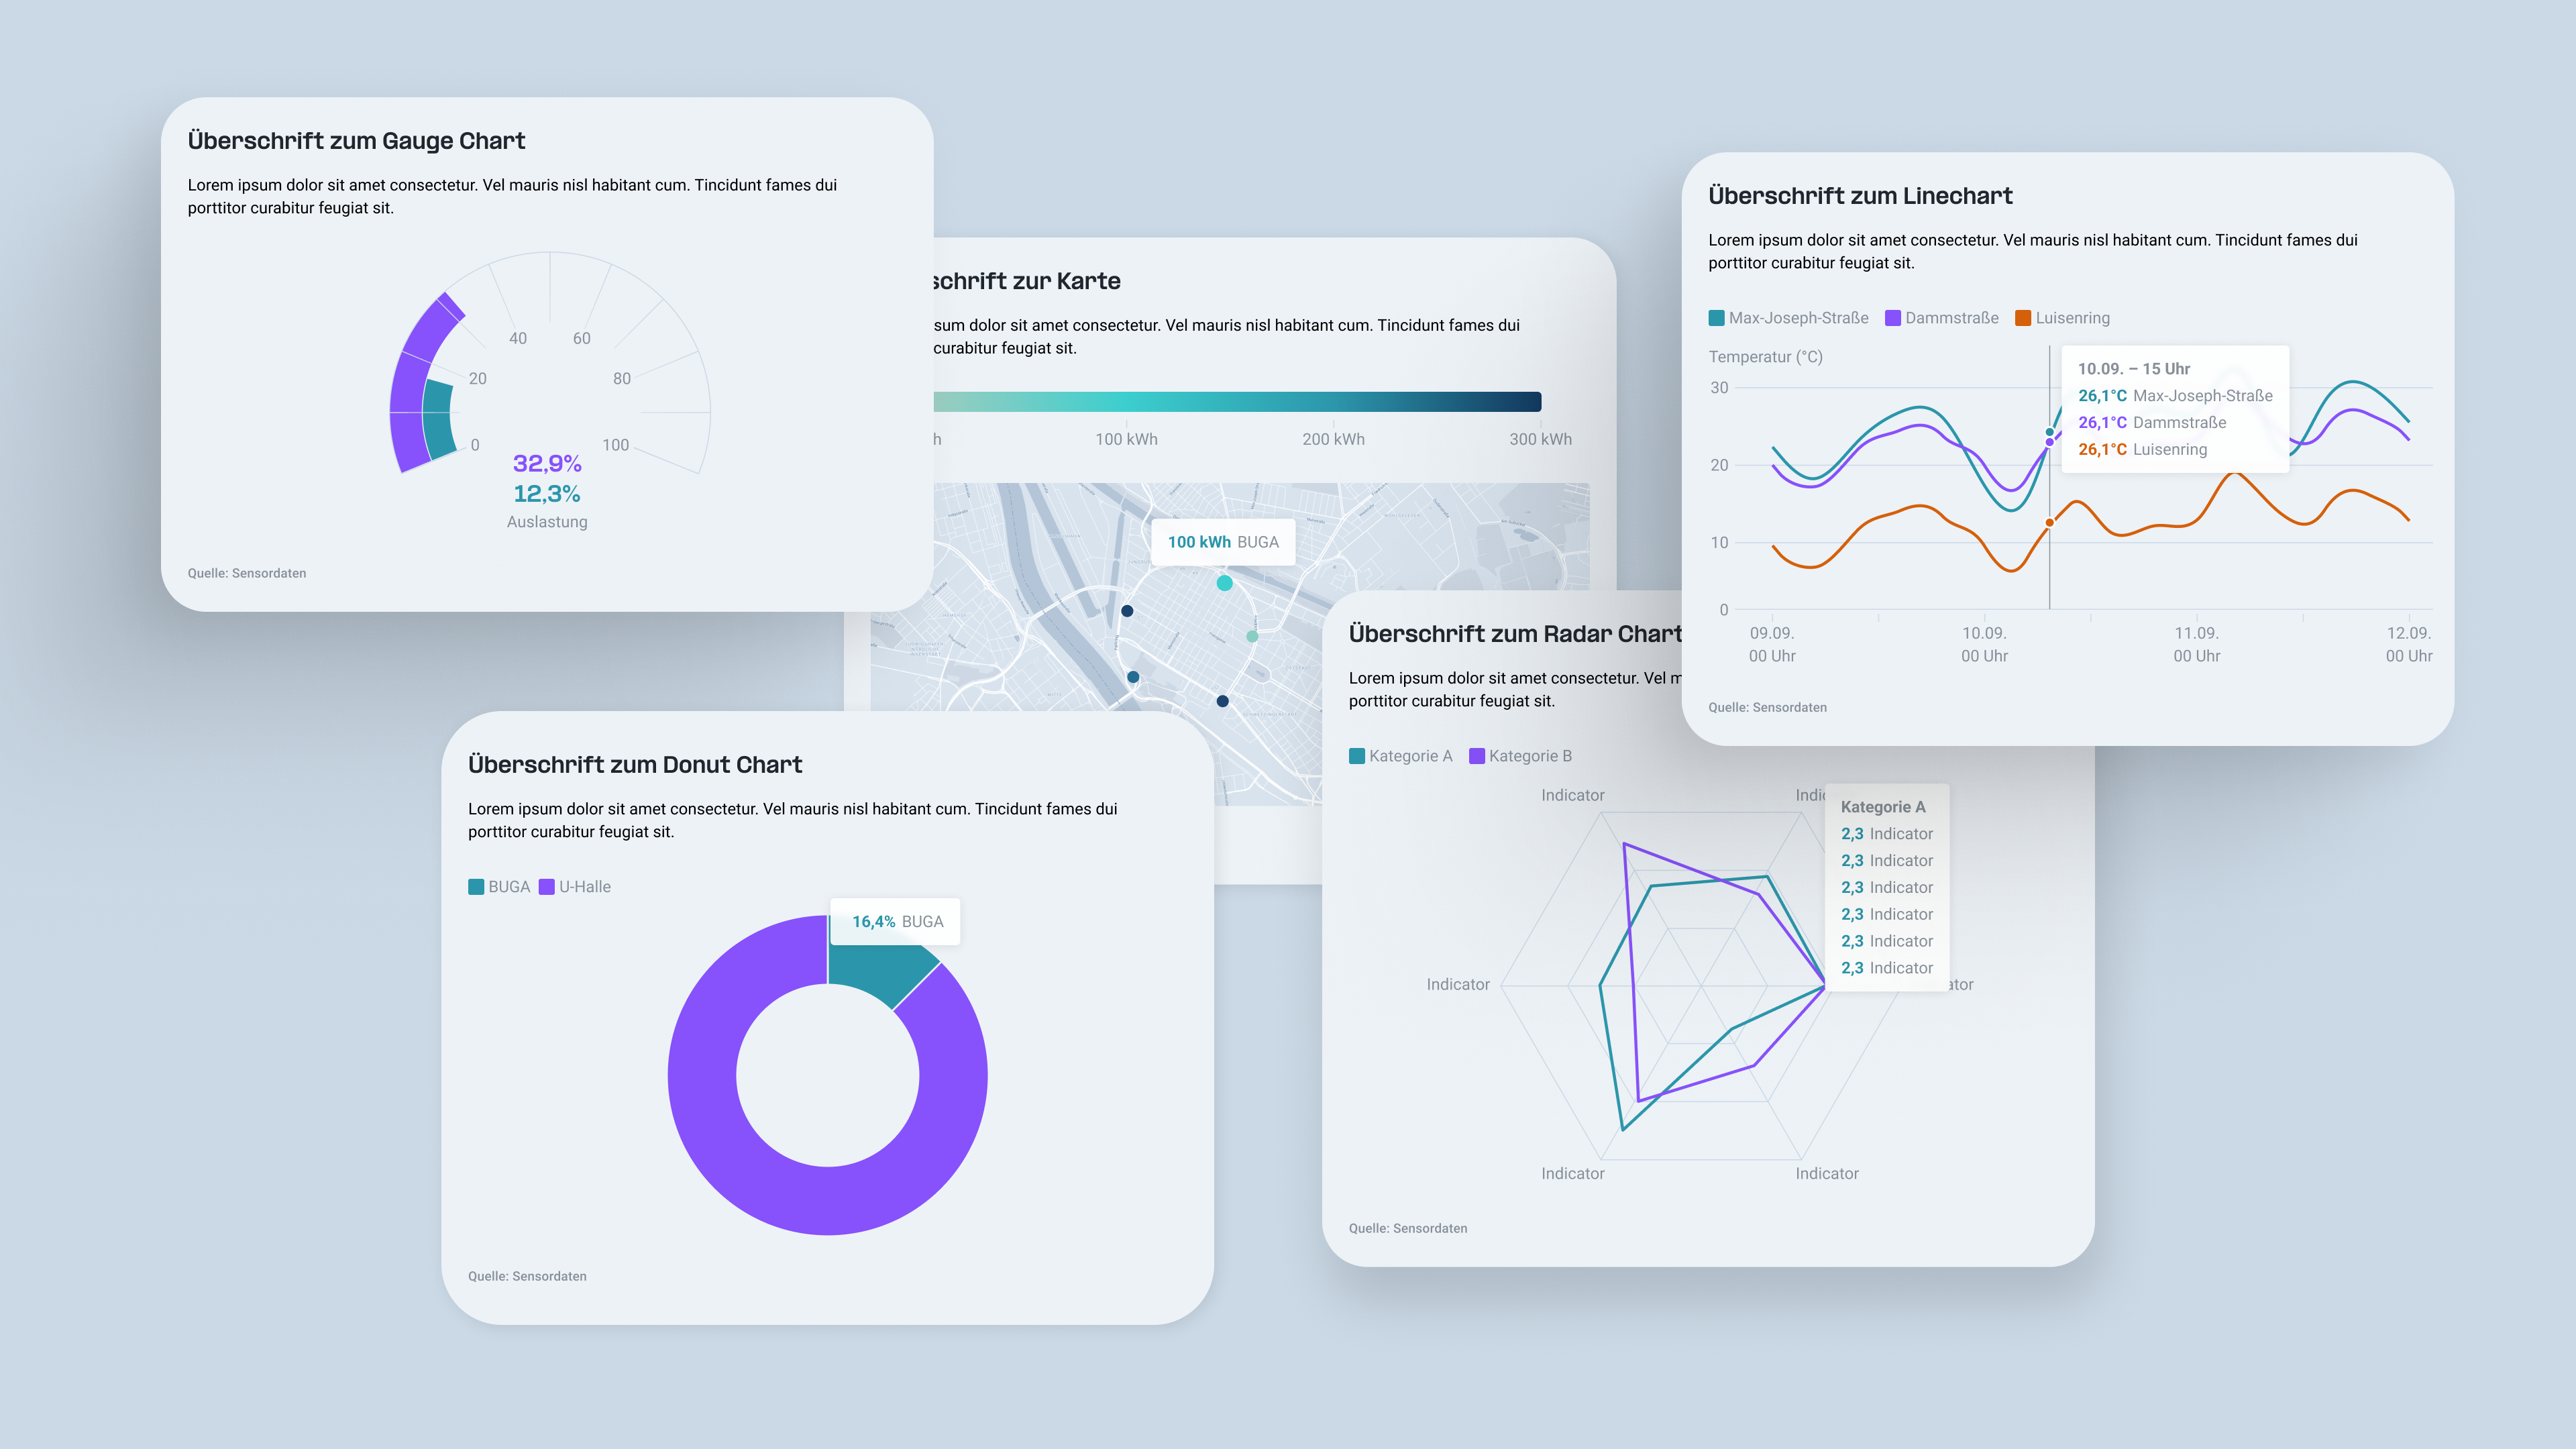
Dashboard showing various charts including a gauge chart with 82.9% and 12.3%, a map with data points, a line chart with multiple colored lines, a purple donut chart, and a radar chart with overlapping data series.

A modular design system enables the client to independently populate the website and create custom graphics based on the new corporate design. Colored image sections can be combined with drawn elements and colored areas to form symbols, illustrations, or infographics. A color and tag system assigns content to specific topics, while various tile variants ensure a clear and structured layout.
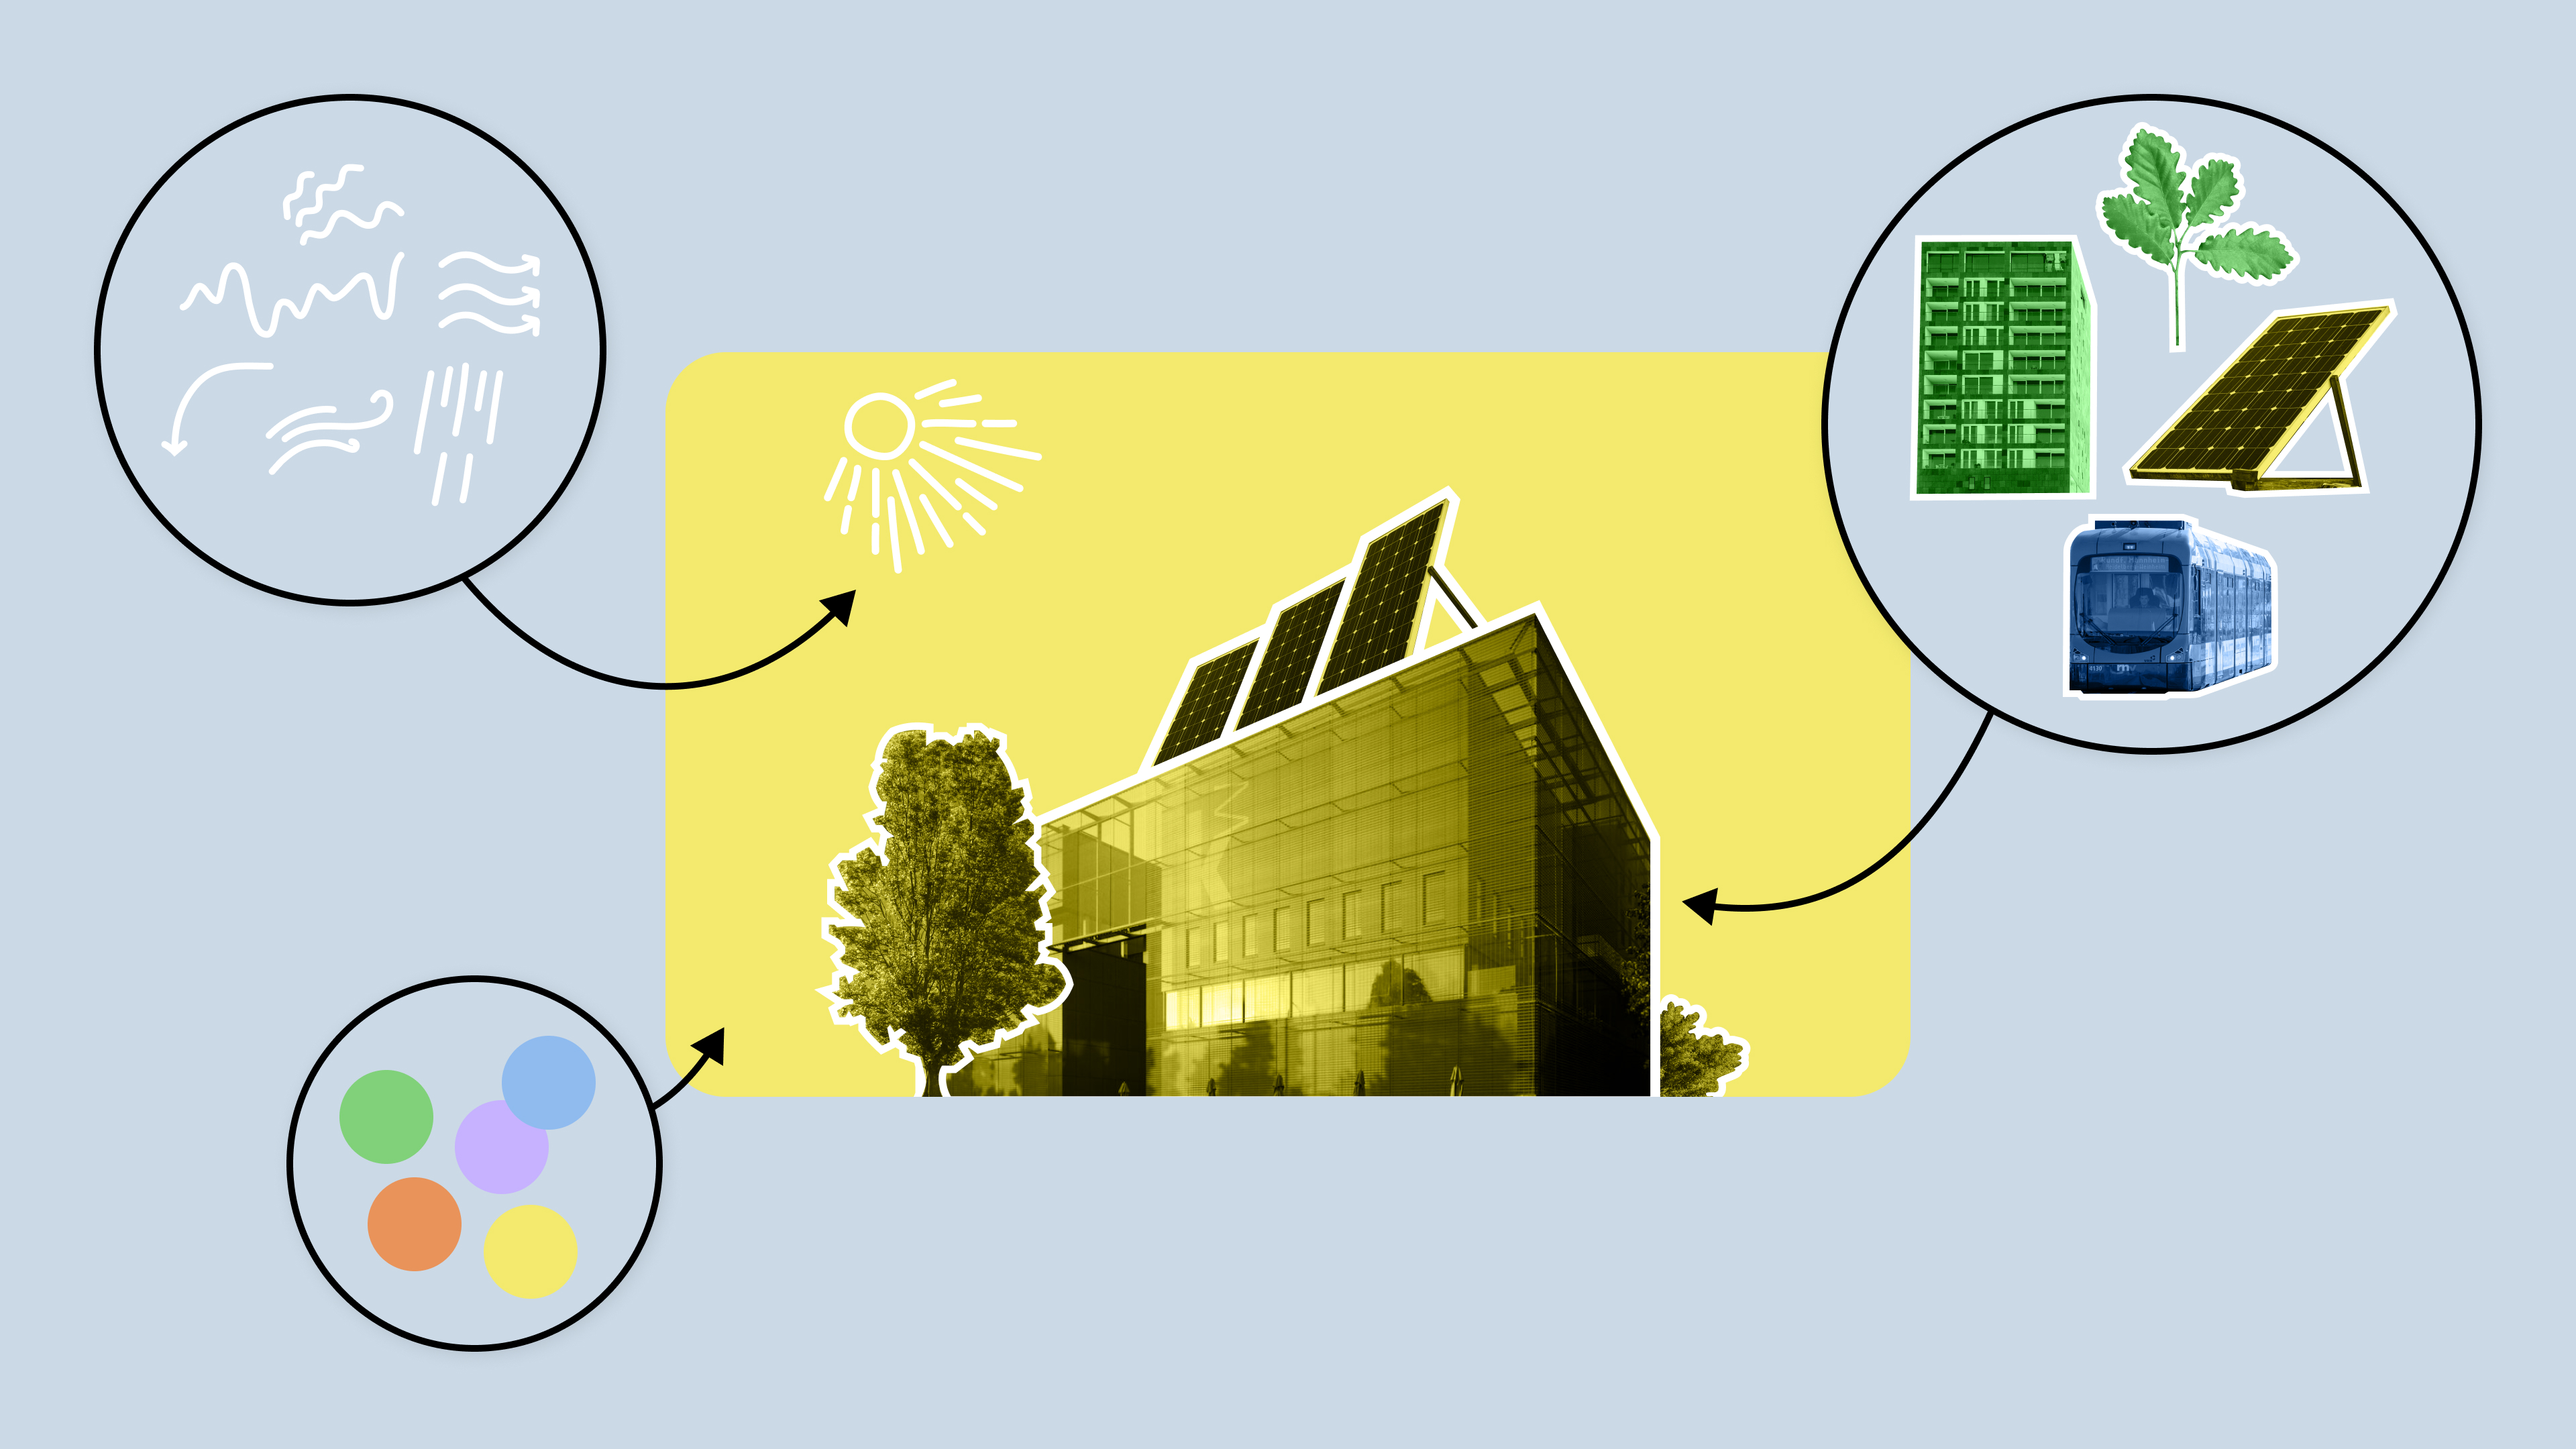
Modern building with solar panels on the roof surrounded by icons representing sunlight, energy sources, and environmental elements
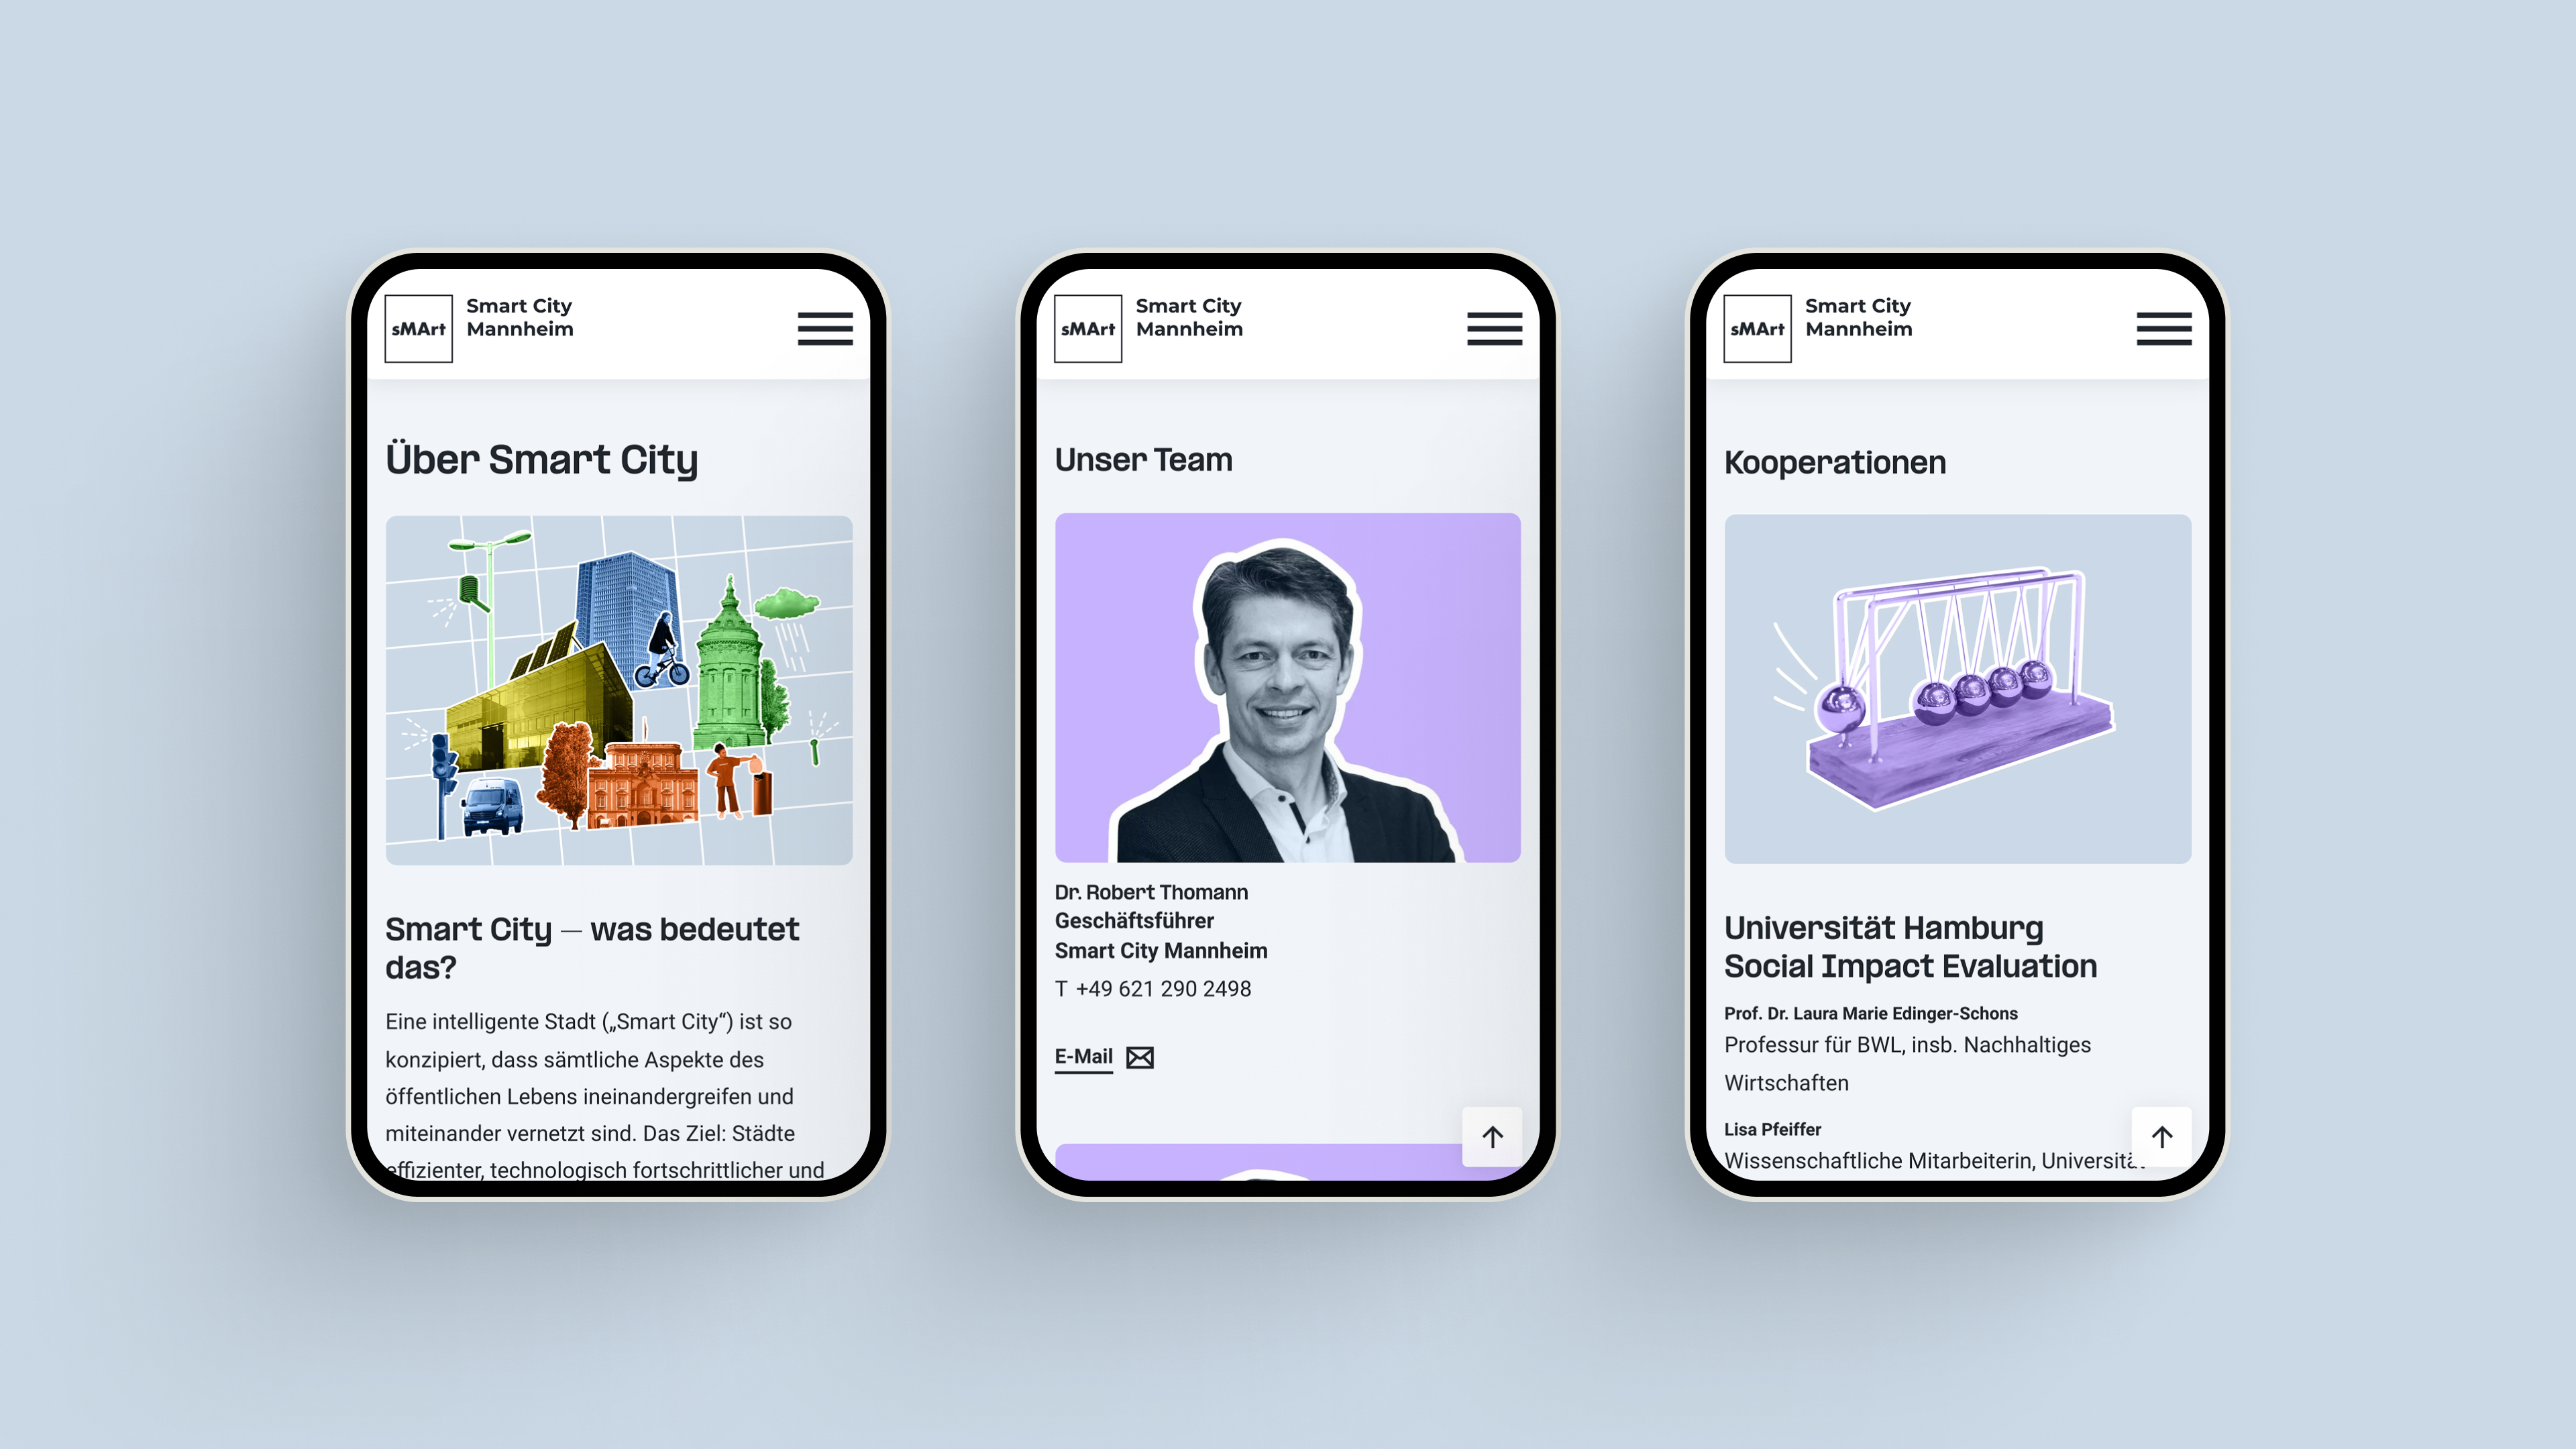
Three smartphone screens showing a Smart City website: first screen with a city model and text about Smart City concept; second screen with a portrait of Dr. Robert Thomsen and his contact details; third screen with an illustration of Newton's cradle and information about cooperation with Universität Hamburg.